Hello,
I want to adjust the x position of my ylabel, like
subplot(111)
ylabel('YLabel', x=-.25, y=.75)
the 'y=.75' argument is applied but the 'x=-.2' argument has no affect.
But why? Have you any idea to do this?
Thank you,
Friedrich
Hello,
I want to adjust the x position of my ylabel, like
subplot(111)
ylabel('YLabel', x=-.25, y=.75)
the 'y=.75' argument is applied but the 'x=-.2' argument has no affect.
But why? Have you any idea to do this?
Thank you,
Friedrich
The x position is automatically determined by the size of the
yticklabels. We should provide a means to override this x position,
but it is not possible currently.
JDH
On Thu, Jun 19, 2008 at 5:16 AM, Friedrich Hagedorn <friedrich_h@...380...> wrote:
Hello,
I want to adjust the x position of my ylabel, like
subplot(111)
ylabel('YLabel', x=-.25, y=.75)the 'y=.75' argument is applied but the 'x=-.2' argument has no affect.
But why? Have you any idea to do this?
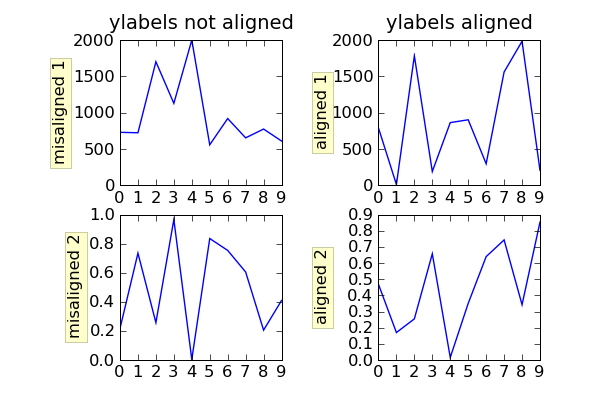
Since our typical mantra is "we don't do much autolayout but we make
it possible for you to layout your figure as you like", I wasn't
satisfied with my answer, so I committed a patch to svn which supports
setting the label coords. See the example below
import numpy as np
import matplotlib.pyplot as plt
box = dict(facecolor='yellow', pad=5, alpha=0.2)
fig = plt.figure()
fig.subplots_adjust(left=0.2, wspace=0.6)
ax1 = fig.add_subplot(221)
ax1.plot(2000*np.random.rand(10))
ax1.set_title('ylabels not aligned')
ax1.set_ylabel('misaligned 1', bbox=box)
ax1.set_ylim(0, 2000)
ax3 = fig.add_subplot(223)
ax3.set_ylabel('misaligned 2',bbox=box)
ax3.plot(np.random.rand(10))
labelx = -0.3 # axes coords
ax2 = fig.add_subplot(222)
ax2.set_title('ylabels aligned')
ax2.plot(2000*np.random.rand(10))
ax2.set_ylabel('aligned 1', bbox=box)
ax2.yaxis.set_label_coords(labelx, 0.5)
ax2.set_ylim(0, 2000)
ax4 = fig.add_subplot(224)
ax4.plot(np.random.rand(10))
ax4.set_ylabel('aligned 2', bbox=box)
ax4.yaxis.set_label_coords(labelx, 0.5)
plt.show()
On Thu, Jun 19, 2008 at 11:02 AM, John Hunter <jdh2358@...287...> wrote:
I want to adjust the x position of my ylabel, like
subplot(111)
ylabel('YLabel', x=-.25, y=.75)the 'y=.75' argument is applied but the 'x=-.2' argument has no affect.
But why? Have you any idea to do this?The x position is automatically determined by the size of the
yticklabels. We should provide a means to override this x position,
but it is not possible currently.
Oh, thank you very much. The
gca().yaxis.set_label_coords(x, y)
command works fine for me ![]()
But one qusetion. I think the user interface
ylabel('yLabel', xpos, ypos)
would be better. So I would do somethink like this in ylabel()
if xpos is not None:
self.set_label_coords(xpos, ypos)
What do you think?
Many thanks,
Friedrich
On Thu, Jun 19, 2008 at 12:36:02PM -0500, John Hunter wrote:
On Thu, Jun 19, 2008 at 11:02 AM, John Hunter <jdh2358@...287...> wrote:
>> I want to adjust the x position of my ylabel, like
>>
>> subplot(111)
>> ylabel('YLabel', x=-.25, y=.75)
>>
>> the 'y=.75' argument is applied but the 'x=-.2' argument has no affect.
>> But why? Have you any idea to do this?
>
> The x position is automatically determined by the size of the
> yticklabels. We should provide a means to override this x position,
> but it is not possible currently.Since our typical mantra is "we don't do much autolayout but we make
it possible for you to layout your figure as you like", I wasn't
satisfied with my answer, so I committed a patch to svn which supports
setting the label coords. See the example below