I’m looking for a way to more freely position colorbar. After review many online posts, I think end up using ax.inset_axes.
For example:
import matplotlib.pyplot as plt
import numpy as np
np.random.seed(1)

fig, ax = plt.subplots(figsize=(5, 5))
# inset axes to contain colorbar
axins = ax.inset_axes([0.2, 0.8, 0.5, 0.6], frameon=True)
im = ax.imshow(np.random.rand(11,16))
# plot colorbar
cbar = fig.colorbar(im, ax=axins, orientation='horizontal', aspect=25)
cbar.ax.set_title('colorbar')
which gives me:
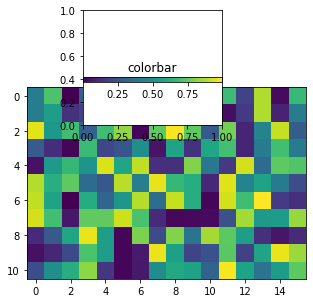
However, if I change ax.inset_axes([0.2, 0.2, 0.5, 0.6], frameon=True), I will get
The position in my inset axes changed to the bottom somehow. Meanwhile, the size of the colorbar could also be affected sometimes if you change the width and height of the inset axes.
I have also tried to change panchor arg, but it doesn’t seem to do anything at all.
So I really wonder if there is a better way to control the position and size of the colorabr.
Could you guys please change the image number limit? Just one image per post?
Did you try the cax parameter to colorbar?
Thanks buddy. It does work! If I did like to change something, do I still need to use cbar.ax to access to those axes methods or I just need to change the inset axes directly if I use cax?
Well a simple approach using seaborn - less code lines - but may not be what you would like to do :
import numpy as np
import seaborn as sns
np.random.seed(1)
im = np.random.rand(11,16)
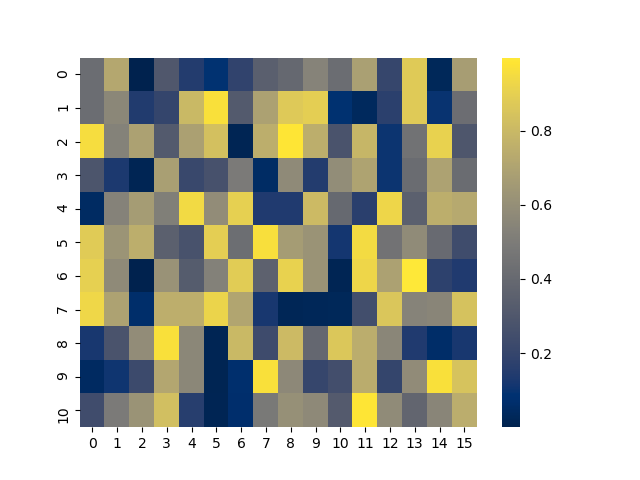
sns.heatmap(im, annot = False, cmap="cividis", square = False, cbar = True,
cbar_kws={"orientation":"vertical"})
Gives you :
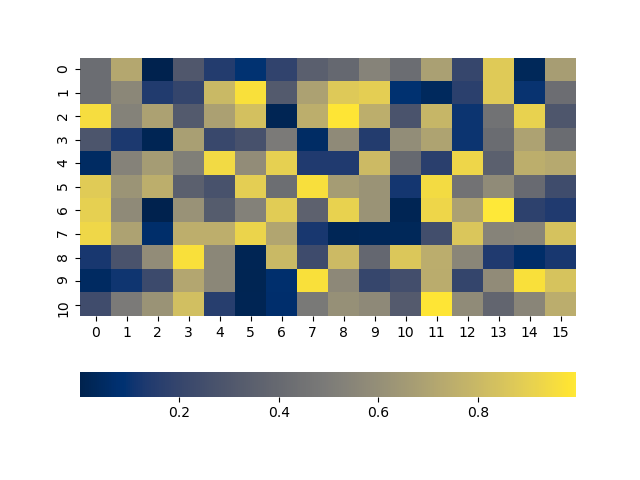
Or using {“orientation”,horizontal"} :
Thanks, but indeed, the question is about colorbar not how to add a colorbar along a heatmap.
Just make an axes using figure.add_axes([x0, y0, width, height]) with the position you want the axes to be at. There are of course more automatic ways…
1 Like
I’m having some issues with get_text(), for example:
import matplotlib.pyplot as plt
from matplotlib.ticker import FixedLocator
from matplotlib.ticker import FixedFormatter
import numpy as np
np.random.seed(1)

fig, ax = plt.subplots(figsize=(5, 5))
# inset axes to contain colorbar
cax = ax.inset_axes([0, 1.2, 0.5, 0.03], frameon=False)
im = ax.imshow(np.random.rand(11,16))
# plot colorbar
cbar = fig.colorbar(im, cax=cax, orientation='horizontal')

x_locator = FixedLocator([cbar.ax.get_xlim()[0], cbar.ax.get_xlim()[1]])
x_formatter = FixedFormatter(['less', 'more'])
cbar.ax.xaxis.set_major_locator(x_locator)
cbar.ax.xaxis.set_major_formatter(x_formatter)

for label in cbar.ax.get_xticklabels():
    # return nothing
    print(label.get_text())

    if label.get_text() == 'less':
        label.set_horizontalalignment('left')
    else:
        label.set_horizontalalignment('right')
I get nothing by running the above code with get_text(). However, if I just run the code below in a different cell
for label in cbar.ax.get_xticklabels():
    print(label.get_text())
I will get
less
more
