Hi all,
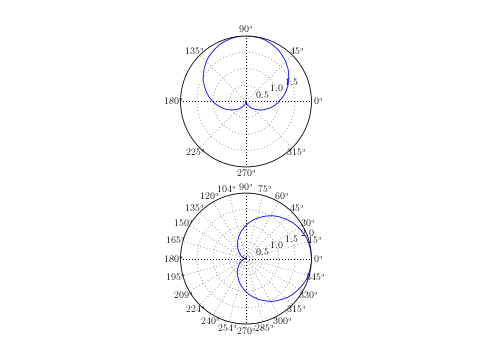
If I run the attached example I obtain no polar plots, but a view like plot(t,r_1) - for what reason ?
Nils
python -i test_subplot_polar.py --verbose-helpful
$HOME=/home/nwagner
CONFIGDIR=/home/nwagner/.matplotlib
/usr/lib/python2.4/site-packages/matplotlib/__init__.py:662: UserWarning: Bad val "inputenc" on line #144
"text.latex.unicode : inputenc # use "ucs" and "inputenc" LaTeX packages for handling
"
in file "/home/nwagner/.matplotlib/matplotlibrc"
Could not convert "inputenc" to boolean
warnings.warn('Bad val "%s" on line #%d\n\t"%s"\n\tin file \
matplotlib data path /usr/lib/python2.4/site-packages/matplotlib/mpl-data
loaded rc file /home/nwagner/.matplotlib/matplotlibrc
matplotlib version 0.98.3
verbose.level helpful
interactive is False
units is False
platform is linux2
Using fontManager instance from /home/nwagner/.matplotlib/fontList.cache
backend GTKAgg version 2.5.3
findfont: Matching :family=sans-serif:style=normal:variant=normal:weight=normal:stretch=normal:size=medium to Bitstream Vera Sans (/usr/lib/python2.4/site-packages/matplotlib/mpl-data/fonts/ttf/Vera.ttf) with score of 1.000000
Found dvipng version 1.5
test_subplot_polar.py (198 Bytes)