Dear all matplotlib users,
Happy New Year.
I try to check the distribution of a 2D array and I find that the histogram plot function doesn’t respect the numpy masked array?
In [188]: a=range(1,6); b=np.array(a+a[::-1])
In [189]: b=np.ma.masked_equal(b,2); b=np.ma.masked_equal(b,5)
In [190]: b
Out[190]:
masked_array(data = [1 – 3 4 – -- 4 3 – 1],
mask = [False True False False True True False False True False],
fill_value = 5)
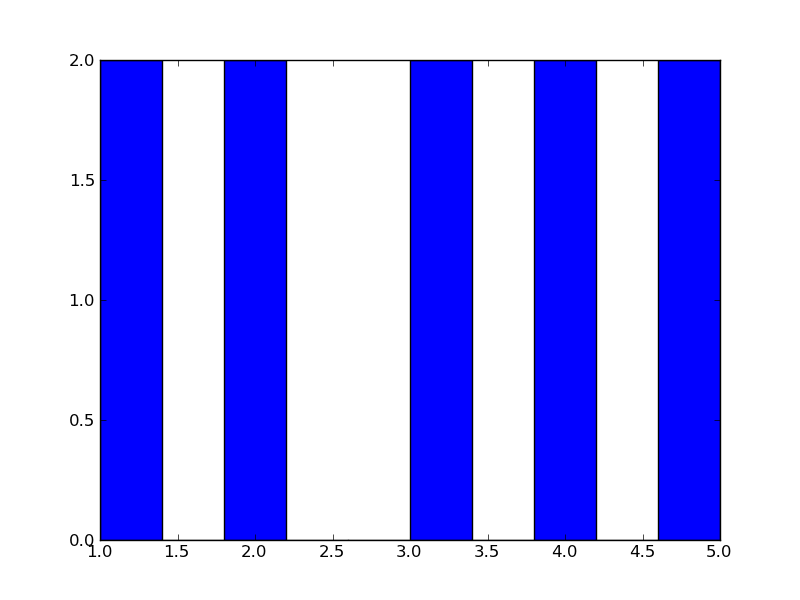
In [191]: n,bins,patches=plt.hist(b)
In [192]: n
Out[192]: array([2, 0, 2, 0, 0, 2, 0, 2, 0, 2])
In [193]: n.sum()
Out[193]: 10
it seems that all the elements (masked or not) are counted in the history plotting?
and the original value is used but not the fill_value?
I attach a figure below.
In [194]: plt.show()
···
–
Chao YUE
Laboratoire des Sciences du Climat et de l’Environnement (LSCE-IPSL)
UMR 1572 CEA-CNRS-UVSQ
Batiment 712 - Pe 119
91191 GIF Sur YVETTE Cedex
Tel: (33) 01 69 08 29 02; Fax:01.69.08.77.16
Yes, this is a known issue (at least, from the comments within the function). Looks like hist() uses np.asarray() instead of np.asanyarray(), which would result in the array being stripped of its mask. However, I don’t think the fix is as straight-forward as changing that to np.asanyarray(). I will take a peek and see what can be done.
Ben Root
···
On Mon, Jan 2, 2012 at 11:10 AM, Chao YUE <chaoyuejoy@…1896…> wrote:
Dear all matplotlib users,
Happy New Year.
I try to check the distribution of a 2D array and I find that the histogram plot function doesn’t respect the numpy masked array?
In [188]: a=range(1,6); b=np.array(a+a[::-1])
In [189]: b=np.ma.masked_equal(b,2); b=np.ma.masked_equal(b,5)
In [190]: b
Out[190]:
masked_array(data = [1 – 3 4 – – 4 3 – 1],
mask = [False True False False True True False False True False],
fill_value = 5)
In [191]: n,bins,patches=plt.hist(b)
In [192]: n
Out[192]: array([2, 0, 2, 0, 0, 2, 0, 2, 0, 2])
In [193]: n.sum()
Out[193]: 10
it seems that all the elements (masked or not) are counted in the history plotting?
and the original value is used but not the fill_value?
I attach a figure below.
In [194]: plt.show()
Thanks Ben.
cheers,
Chao
2012/1/2 Benjamin Root <ben.root@…1304…>
···
On Mon, Jan 2, 2012 at 11:10 AM, Chao YUE <chaoyuejoy@…287…> wrote:
Dear all matplotlib users,
Happy New Year.
I try to check the distribution of a 2D array and I find that the histogram plot function doesn’t respect the numpy masked array?
In [188]: a=range(1,6); b=np.array(a+a[::-1])
In [189]: b=np.ma.masked_equal(b,2); b=np.ma.masked_equal(b,5)
In [190]: b
Out[190]:
masked_array(data = [1 – 3 4 – – 4 3 – 1],
mask = [False True False False True True False False True False],
fill_value = 5)
In [191]: n,bins,patches=plt.hist(b)
In [192]: n
Out[192]: array([2, 0, 2, 0, 0, 2, 0, 2, 0, 2])
In [193]: n.sum()
Out[193]: 10
it seems that all the elements (masked or not) are counted in the history plotting?
and the original value is used but not the fill_value?
I attach a figure below.
In [194]: plt.show()
Yes, this is a known issue (at least, from the comments within the function). Looks like hist() uses np.asarray() instead of np.asanyarray(), which would result in the array being stripped of its mask. However, I don’t think the fix is as straight-forward as changing that to np.asanyarray(). I will take a peek and see what can be done.
Ben Root
–
Chao YUE
Laboratoire des Sciences du Climat et de l’Environnement (LSCE-IPSL)
UMR 1572 CEA-CNRS-UVSQ
Batiment 712 - Pe 119
91191 GIF Sur YVETTE Cedex
Tel: (33) 01 69 08 29 02; Fax:01.69.08.77.16