Hi everyone,
I’m new to matplotlib, and I would like to create a typical plot of a timecourse (markers connected by lines), with the markers varying in size and/or style according to a separate set of data that corresponds to each timepoint. However, my understanding is that plot() will not accept an array of marker sizes, only a single float value that is applied to all markers. On the other hand, scatter() does allow variably-sized markers (as in the scatter_demo2.py example). However, there does not seem to be a straightforward way to add lines to this plot connecting markers in sequence. Can anyone recommend a work-around to this issue, or point out if I’ve missed something in the documentation?
Thanks,
Tim
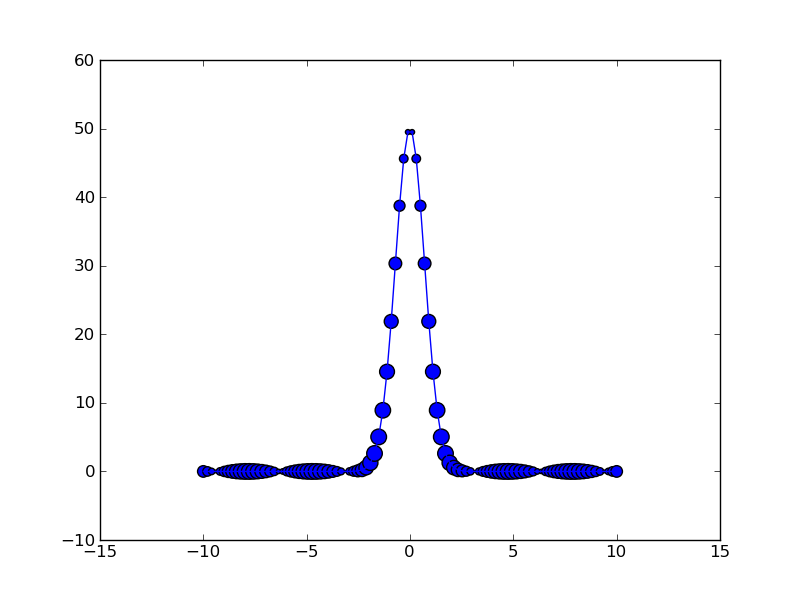
You could use plot and scatter on the same plot. See the attached example.
plot_and_scatter.py (217 Bytes)
···
On 07/26/2010 08:18 PM, Timothy Vickery wrote:
Hi everyone,
I'm new to matplotlib, and I would like to create a typical plot of a
timecourse (markers connected by lines), with the markers varying in
size and/or style according to a separate set of data that corresponds
to each timepoint. However, my understanding is that plot() will not
accept an array of marker sizes, only a single float value that is
applied to all markers. On the other hand, scatter() does allow
variably-sized markers (as in the scatter_demo2.py example). However,
there does not seem to be a straightforward way to add lines to this
plot connecting markers in sequence. Can anyone recommend a work-around
to this issue, or point out if I've missed something in the documentation?
Thanks,
Tim
#-------------------------------------------
import numpy as np
import matplotlib.pyplot as plt
N = 100
x = np.linspace(-10.0,10.0,N)
y = 50.0*np.exp(-x**2)
size = 100.0*np.abs(np.sin(x))
plt.plot(x,y)
plt.scatter(x,y,s=size)
plt.show()
#-------------------------------------------
Regards,
Jo�o Lu�s