antonv wrote:
Better yet, here is the file that I am using on my testing but keep in mind
that it's a 33mb file:
http://downloads.75ive.com/enp.t18z.grib.grib2
Anton: I had already downloaded a file from the ftp site, so here's an example script:
import Nio
from mpl_toolkits.basemap import Basemap
import matplotlib.pyplot as plt
import numpy as np
f = Nio.open_file('akw.t00z.grib.grib2')
print f.variables.keys()
lons = f.variables['lon_0'][:]
# flip latitudes so data goes S-->N
lats = f.variables['lat_0'][::-1]
times = f.variables['forecast_time0'][:]
datavar = f.variables['WWSWHGT_P0_L1_GLL0']
ntime = 10
data = datavar[ntime,::-1]
print f.variables['WWSWHGT_P0_L1_GLL0']
print data.min(), data.max()
m = Basemap(projection='cyl',llcrnrlat=lats[0],llcrnrlon=lons[0],\
urcrnrlat=lats[-1],urcrnrlon=lons[-1],resolution='l')
x, y = m(*np.meshgrid(lons, lats))
levels = np.arange(0,9.1,0.5)
m.contourf(x,y,data,levels)
m.drawcoastlines()
m.fillcontinents()
m.drawparallels(np.arange(40,81,10),labels=[1,0,0,0])
m.drawmeridians(np.arange(150,241,10),labels=[0,0,0,1])
m.drawparallels(np.arange(40,81,10),labels=[1,0,0,0])
m.drawmeridians(np.arange(150,241,10),labels=[0,0,0,1])
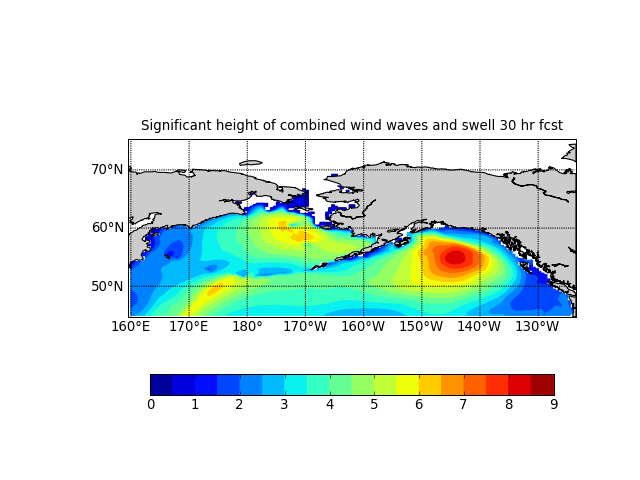
plt.title(datavar.long_name+' %s hr fcst'%(times[ntime]),fontsize=12)
plt.colorbar(orientation='horizontal',shrink=0.9,format="%g")
plt.show()
The resulting plot is attached.
Note you will need the Basemap toolkit (available from the matplotlib download site). If you don't want to plot the coastlines, you can just use plt.contourf. You'll also need PyNIO (The Nio module for reading and writing supported data formats) to read the GRIB file.
The png produced by this script is attached.
Let me know if you have any questions.
-Jeff
···
antonv wrote:
Here is the link to the folder that has the grib files. They are updated
every 3 hours:
ftp://ftpprd.ncep.noaa.gov/pub/data/nccf/com/wave/prod/
Any of the files there would have the same info only at different times of
day.