Hello,
I’v made a small program which plots data from a CAN-bus log file. Some of the data to plot is logical type on/off values (bit on or off). I have tried to find a way to plot this kind of data with no success.
Basically what I want to do is to draw a horizontal line with relative y co-ordinates and absolute xmin and xmax co-ordinate. Then I could draw a line when a bit is high and have it always in plot area even when zooming etc. Like axhline(…) but with relative y and absolute x co-ordinates. Another way to do this could be using subplots, but I can’t figure out how to use same x-scale on the both plots.
Any suggestions?
Best Regards
Timo
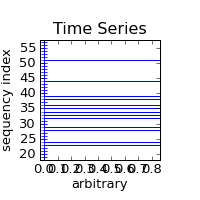
Do you want something like the attached?
I created it with my package that no-one wants 
import diagram_cl
import diagram_cl.kernels.tk
import numpy
import Tkinter
d1 = diagram_cl.Diagram()
series = (numpy.random.random(100) > 0.5).astype(numpy.float)
for idx in xrange(0, len(series)):
... layer = diagram_cl.Layer2D(x = [0, series[idx]], y = [idx,
idx], color = 'blue')
... d1.add_layer(layer)
...
tk = Tkinter.Tk()
k1 = diagram_cl.kernels.tk.Diagram(tk, d1)
Double-right click on the figure, "Save", 200x200, "Bits.png".
But of course, you can also do it with normal matplotlib (I'm not used
to the pyplot things though, I'm rather using purist's API):
Hmm, that's why it would be not the standard way to do it, so can
anyone else post pure matplotlib means?
Friedrich
Not sure what exactly you want. Is this close?
ax = subplot(111)
tr = ax.get_xaxis_transform()
ax.plot([0.2, 0.8], [0.5, 0.5],
transform=tr)
The x-coodinate is in data coordinate, but y coordinate is in
(normalized) axes coordinate.
More about the transforms behind matplotlib can be found in
http://matplotlib.sourceforge.net/trunk-docs/users/transforms_tutorial.html
-JJ
···
On Thu, Mar 4, 2010 at 3:10 AM, Timo Heine <timo.heine@...287...> wrote:
Hello,
I'v made a small program which plots data from a CAN-bus log file. Some of
the data to plot is logical type on/off values (bit on or off). I have tried
to find a way to plot this kind of data with no success.
Basically what I want to do is to draw a horizontal line with relative y
co-ordinates and absolute xmin and xmax co-ordinate. Then I could draw a
line when a bit is high and have it always in plot area even when zooming
etc. Like axhline(...) but with relative y and absolute x
co-ordinates. Another way to do this could be using subplots, but I can't
figure out how to use same x-scale on the both plots.
Any suggestions?
Best Regards
Timo
------------------------------------------------------------------------------
Download Intel® Parallel Studio Eval
Try the new software tools for yourself. Speed compiling, find bugs
proactively, and fine-tune applications for parallel performance.
See why Intel Parallel Studio got high marks during beta.
http://p.sf.net/sfu/intel-sw-dev
_______________________________________________
Matplotlib-users mailing list
Matplotlib-users@lists.sourceforge.net
matplotlib-users List Signup and Options
2010/3/4 Timo Heine <timo.heine@...287...>:
Basically what I want to do is to draw a horizontal line with relative y
co-ordinates and absolute xmin and xmax co-ordinate. Then I could draw a
line when a bit is high and have it always in plot area even when zooming
etc. Like axhline(...) but with relative y and absolute x
co-ordinates.
I found a better solution candidate now, but I don't know whether it works:
import matplotlib.transforms
import matplotlib.lines
<create Axes instance by calling fig.add_axes() or fig.add_subplot()>
trans = matplotlib.transforms.blended_transform_factory(axes.transData,
axes.transAxes)
line = matplotlib.lines.Line2D([xmin, xmax], [yrel, yrel], transform =
trans, <whatever like color = 'r'>)
line.y_isdata = False
axes.add_line(line)
The code is taken from axes.py:Axes.axhline() with some alterations.
Friedrich