Hello,
I have a question about plotting pressure contours with matplotlib.
I've seen other applications using matplotlib where the pressure contours are drawn with annoted text "H" and "L" characters being drawn in the centers of closed contours...
i.e., if there is a closed contour line, and its value is over a certain threshold value, plot an "H" to indicate a "high pressure zone", else plot a "L" to indicate a "low pressure zone."
This is standard weather map plotting stuff, and Ive definitely seen other plots produced using matplotlib that inlude these annoted "H" and "L" characters. In the application Ive seen, the process was most definitely automated, since it was applied to a large number of plots (i.e., the "H"'s and "L"'s werent added manually, since its not feasible). Unfortunately, the creators of these plots are not willing to share their technique.
I dont know how to set this up with matplotlib.
Does anyone have any experience with this???
Is there any way to identify a "closed contour" & its value from a "contour class" that is returned from matplotlib's contour() function???
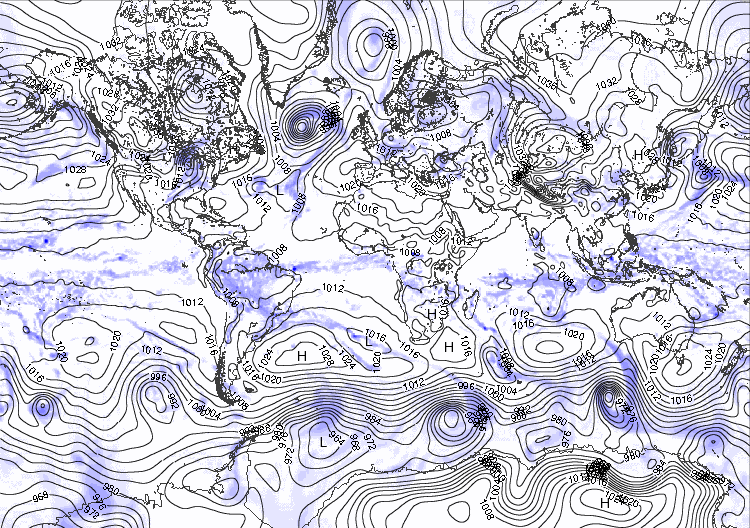
I've attached a sample matplotlib/basemap plot that shows what I want to accomplish (again, its creators are unwiling to help me). You can see the "H" and "L" characters in the centers of high&low pressure closed contours.
Hello,
I have a question about plotting pressure contours with matplotlib.
I've seen other applications using matplotlib where the pressure contours are drawn with annoted text "H" and "L" characters being drawn in the centers of closed contours...
i.e., if there is a closed contour line, and its value is over a certain threshold value, plot an "H" to indicate a "high pressure zone", else plot a "L" to indicate a "low pressure zone."
This is standard weather map plotting stuff, and Ive definitely seen other plots produced using matplotlib that inlude these annoted "H" and "L" characters. In the application Ive seen, the process was most definitely automated, since it was applied to a large number of plots (i.e., the "H"'s and "L"'s werent added manually, since its not feasible). Unfortunately, the creators of these plots are not willing to share their technique.
I dont know how to set this up with matplotlib.
Does anyone have any experience with this???
Is there any way to identify a "closed contour" & its value from a "contour class" that is returned from matplotlib's contour() function???
Pablo: There is no easy way to do this in matplotlib. I guess you would try to find closed contours with no other contours inside them, the place the label at the center of that region. This might end up being quite tricky. I see from your example that there are many such regions that are not labelled (some are, some aren't).
Or, you might just try to find local minima and maxima in your gridded data and plot H's and L's there. This ought to be easier.
-Jeff
Pablo: Regarding the latter method, here's a relevant thread from the scipy list: