I tried the following code -
import matplotlib
import matplotlib.pyplot as plt
import datetime
customdate = datetime.datetime(2016, 1, 1, 13, 30)
y = [ 2,4,6,8,10,12,14,16,18,20 ]
x = [customdate + datetime.timedelta(hours=i) for i in range(len(y))]
_fig,_ax = plt.subplots()
plot
_ax.plot_date(x,y, drawstyle=‘steps-post’)
plt.gcf().autofmt_xdate()
plt.show()
and got the output as -
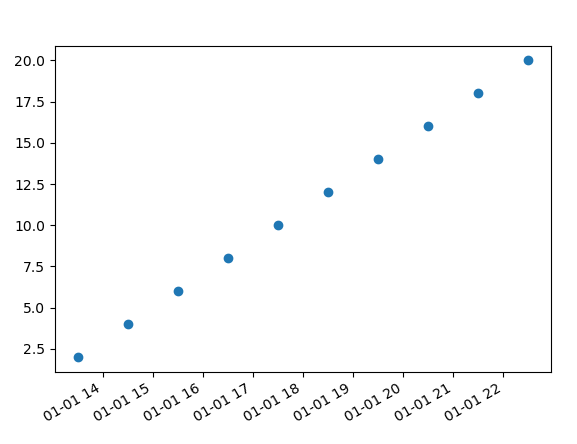
The step plot is not created, but when I change to
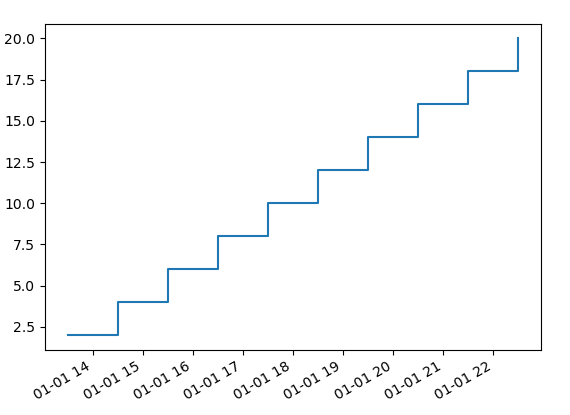
_ax.plot(x,y, drawstyle=‘steps-post’) instead plot_date
I get a step plot
Why is the drawstyle not applied to plot_date ?