Hi all,
I’m a newbie, I’m trying to plot a line with an arrow
(arrow in the middle and another with an arrow at
the end) with the following points: [1, 2] and [5, 2]
Could anyone please help me with the code?
Thanks.
Harriet A. Welbeck
Hi all,
I’m a newbie, I’m trying to plot a line with an arrow
(arrow in the middle and another with an arrow at
the end) with the following points: [1, 2] and [5, 2]
Could anyone please help me with the code?
Thanks.
Harriet A. Welbeck
Check the gallery where a few example shows you how to draw arrows.
My recommendation is to use "annotate" with empty string.
e.g.,
annotate("", (1,2), xytext=(5,2), arrowprops=dict(fc="b"))
http://matplotlib.sourceforge.net/api/pyplot_api.html?highlight=annotate#matplotlib.pyplot.annotate
However, a line with an arrow in the middle is not supported. But
something like below may be close enough?
annotate("", (3,5), xytext=(5,5),
arrowprops=dict(arrowstyle="->", fc="b", shrinkB=0))
annotate("", (1,5), xytext=(3,5),
arrowprops=dict(arrowstyle="-", fc="b", shrinkA=0))
-JJ
On Tue, Jul 14, 2009 at 2:13 PM, Afi Welbeck<welby555@...9...> wrote:
Hi all,
I'm a newbie, I'm trying to plot a line with an arrow
(arrow in the middle and another with an arrow at
the end) with the following points: [1, 2] and [5, 2]
Could anyone please help me with the code?
Thanks.
Harriet A. Welbeck------------------------------------------------------------------------------
Enter the BlackBerry Developer Challenge
This is your chance to win up to $100,000 in prizes! For a limited time,
vendors submitting new applications to BlackBerry App World(TM) will have
the opportunity to enter the BlackBerry Developer Challenge. See full prize
details at: http://p.sf.net/sfu/Challenge
_______________________________________________
Matplotlib-users mailing list
Matplotlib-users@lists.sourceforge.net
matplotlib-users List Signup and Options
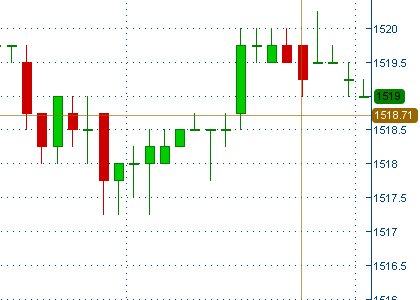
Hello,
I am trying to add some annotations onto an axis as shown in the attached picture.
Is that do-able? If yes, any pointers on how to achieve this are welcome.
Thanks,
Christophe
Drawing box around a text is quite easy.
http://matplotlib.sourceforge.net/examples/pylab_examples/fancytextbox_demo.html
To place a text in a way like ticklabels, you need to use blended transform.
The short example may give you some starting point.
-JJ
from matplotlib.transforms import blended_transform_factory
ax = subplot(111)
# x position in axes coordinate : 1.02
# y position in data coordinate : 0.3
t = ax.text(1.02, 0.3, "label", ha="left",
transform=blended_transform_factory(ax.transAxes,
ax.transData),
bbox=dict(boxstyle="round", fc="cyan"),
)
On Fri, Jul 17, 2009 at 12:51 PM, Christophe Dupre<christophe.dupre@...2631...> wrote:
Hello,
I am trying to add some annotations onto an axis as shown in the attached picture.
Is that do-able? If yes, any pointers on how to achieve this are welcome.Thanks,
Christophe
------------------------------------------------------------------------------
Enter the BlackBerry Developer Challenge
This is your chance to win up to $100,000 in prizes! For a limited time,
vendors submitting new applications to BlackBerry App World(TM) will have
the opportunity to enter the BlackBerry Developer Challenge. See full prize
details at: http://p.sf.net/sfu/Challenge
_______________________________________________
Matplotlib-users mailing list
Matplotlib-users@lists.sourceforge.net
matplotlib-users List Signup and Options