Hello all,
I am trying to plot different data using pcolormesh in subplots. But I get in all subplots
data plotted in the last subplot. It seems it is being overwritten. Only colorbar indicates that the data should be different.
In my opinion what is happening:
subplot is ploted and colorbar is adjusted to its data, but when the second subplot is plotted, data of the first subplot is overwritten with data from the second subplot.
when I use contourf - it does not overwrite the data.
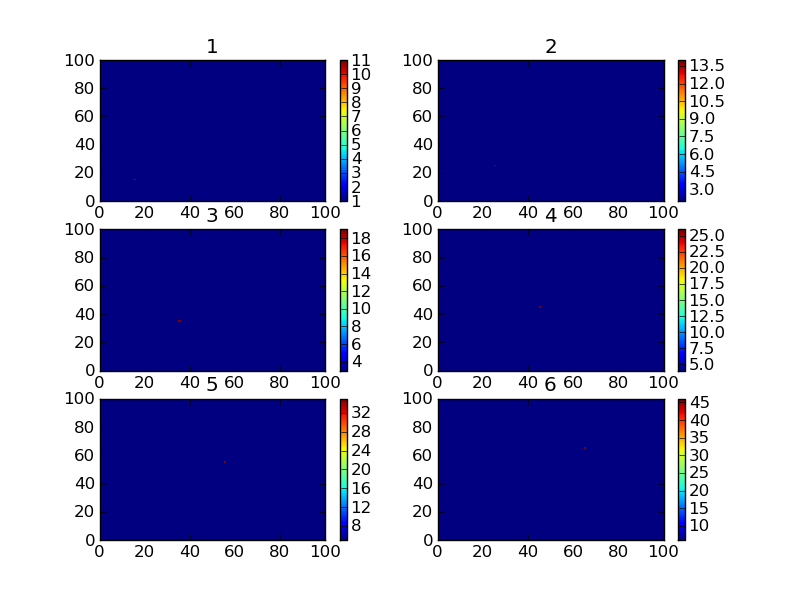
the test code is here (result image is attached, data is the same in the subplots but colorbars are different so the colors are different
but as you see in code I am changing the data):
def test():
y = np.zeros((100,100))
for i in range(1,7):
plt.subplot(3, 2, i)
plt.title(’%d’ % i)
y[:,:] = i
y[5 + 10i, 5 + 10i] = i * i + 10
plt.pcolormesh(y)
plt.colorbar()
plt.savefig(“test_subplots.png”)
matplotlib version: 1.0.0 (Installed using macports)
OS: Darwin citron 10.5.0 Darwin Kernel Version 10.5.0: Fri Nov 5 23:20:39 PDT 2010; root:xnu-1504.9.17~1/RELEASE_I386 i386 i386
Any help is appreciated.
···
–
Oleksandr Huziy
PhD student, UQÀM.
Hi,
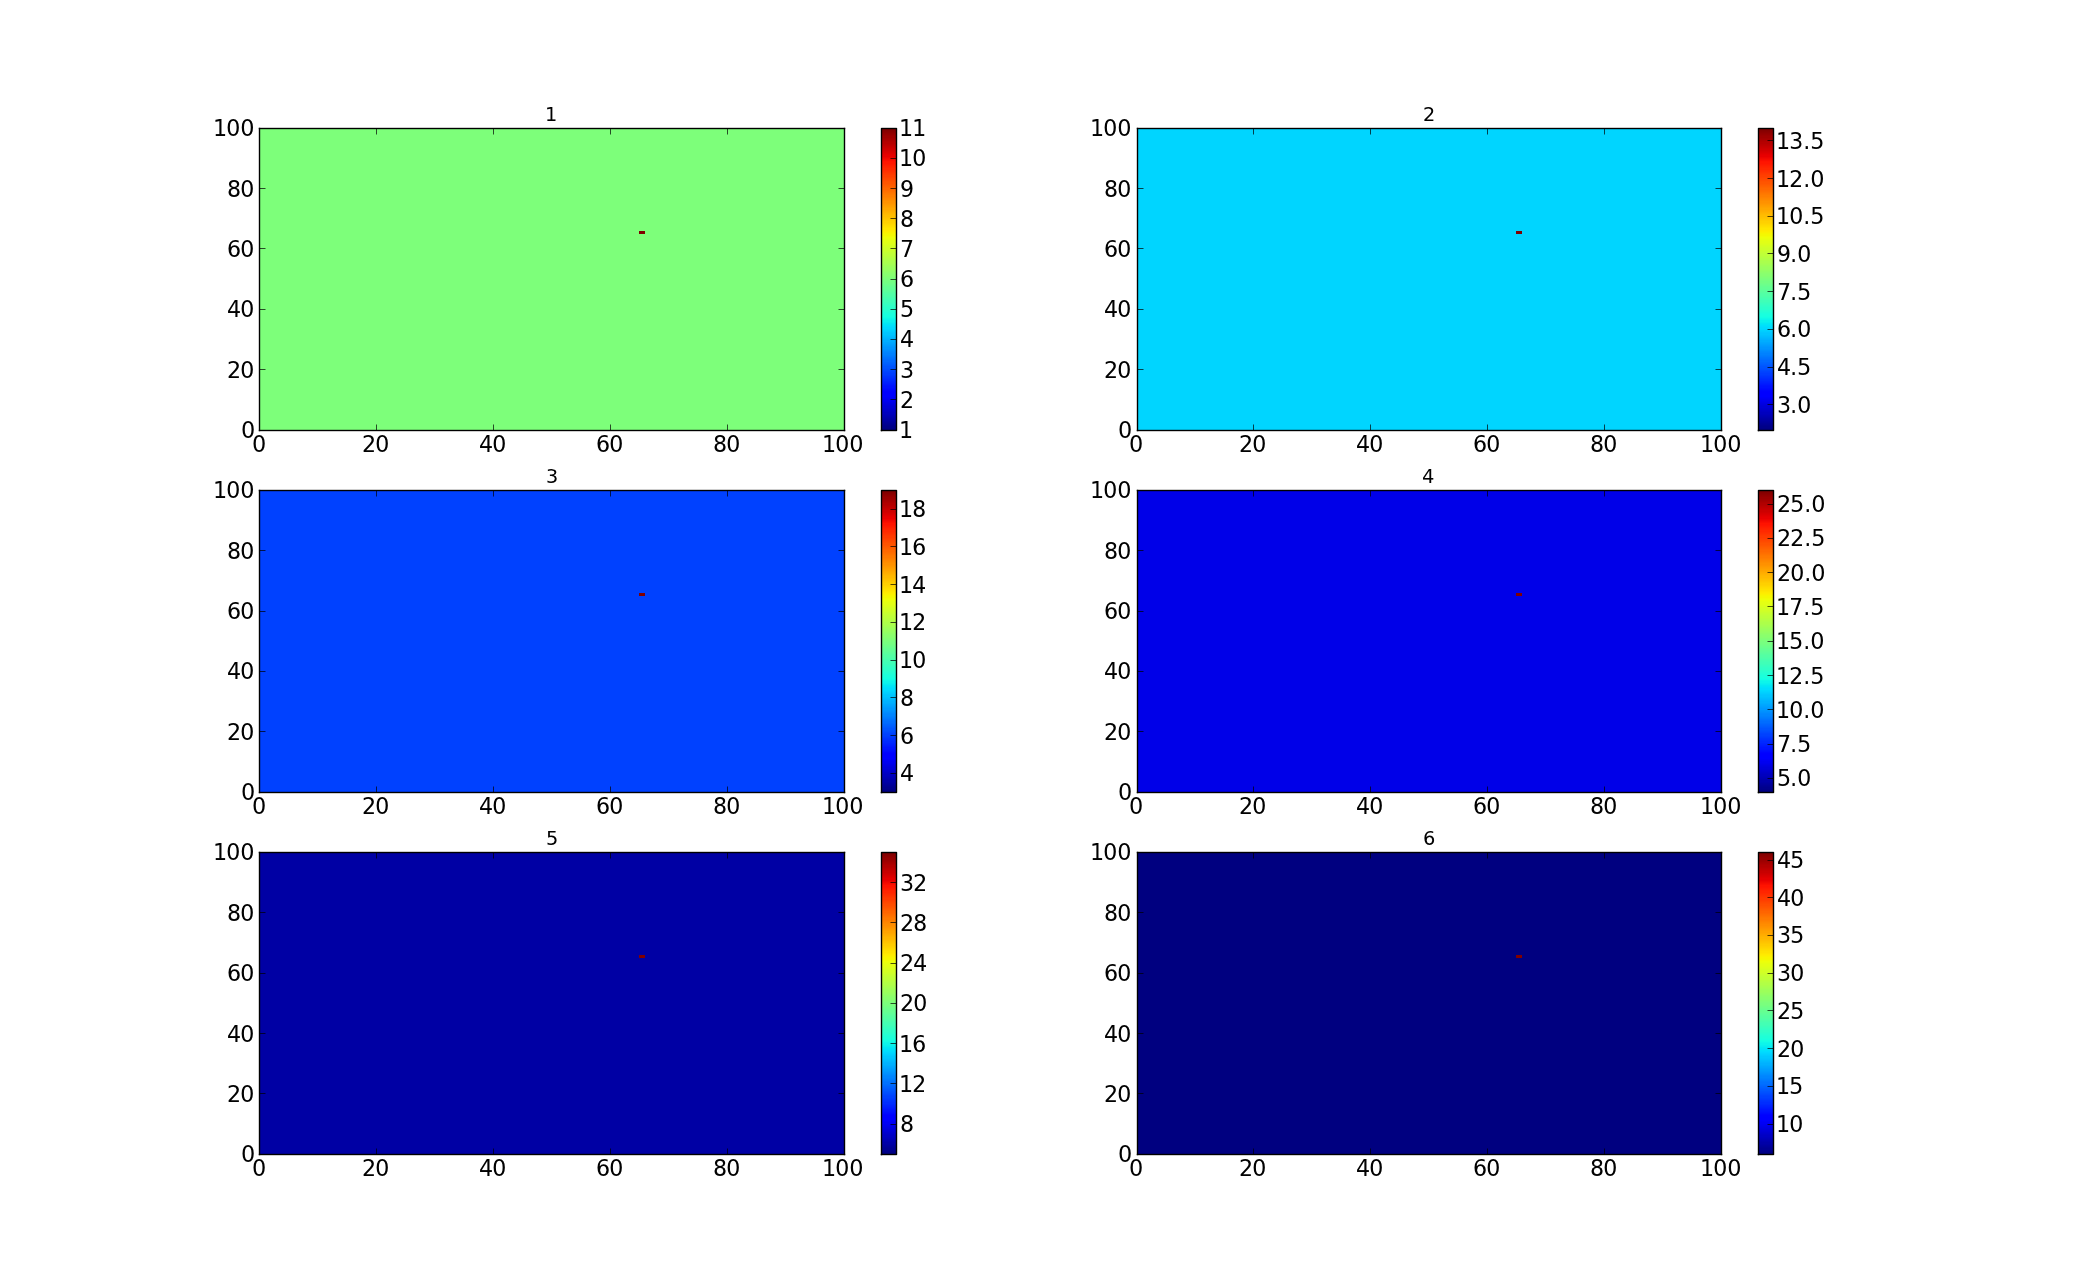
I'm not sure if you are still struggling about this problem. If you do, you
might want to add an '.copy()' to 'y' in the pcolormesh as in the attached
code. I think this is a matter of data vs. pointer to data field. The colorbars
are generated in each step, but the array 'y' is somehow used for all color-
meshes at some final point.
Kind regards and merry Christmas,
Matthias
test_subplots.py (290 Bytes)
···
On Tuesday December 7 2010 20:27:34 Oleksandr Huziy wrote:
Hello all,
I am trying to plot different data using pcolormesh in subplots. But I get
in all subplots
data plotted in the last subplot. It seems it is being overwritten. Only
colorbar indicates that the data should be different.
In my opinion what is happening:
subplot is ploted and colorbar is adjusted to its data, but when the second
subplot is plotted, data of the first subplot is overwritten with data from
the second subplot.
when I use contourf - it does not overwrite the data.
the test code is here (result image is attached, data is the same in the
subplots but colorbars are different so the colors are different
but as you see in code I am changing the data):
def test():
y = np.zeros((100,100))
for i in range(1,7):
plt.subplot(3, 2, i)
plt.title('%d' % i)
y[:,:] = i
y[5 + 10*i, 5 + 10*i] = i * i + 10
plt.pcolormesh(y)
plt.colorbar()
plt.savefig("test_subplots.png")
matplotlib version: 1.0.0 (Installed using macports)
OS: Darwin citron 10.5.0 Darwin Kernel Version 10.5.0: Fri Nov 5 23:20:39
PDT 2010; root:xnu-1504.9.17~1/RELEASE_I386 i386 i386
Any help is appreciated.
--
Oleksandr Huziy
PhD student, UQÀM.