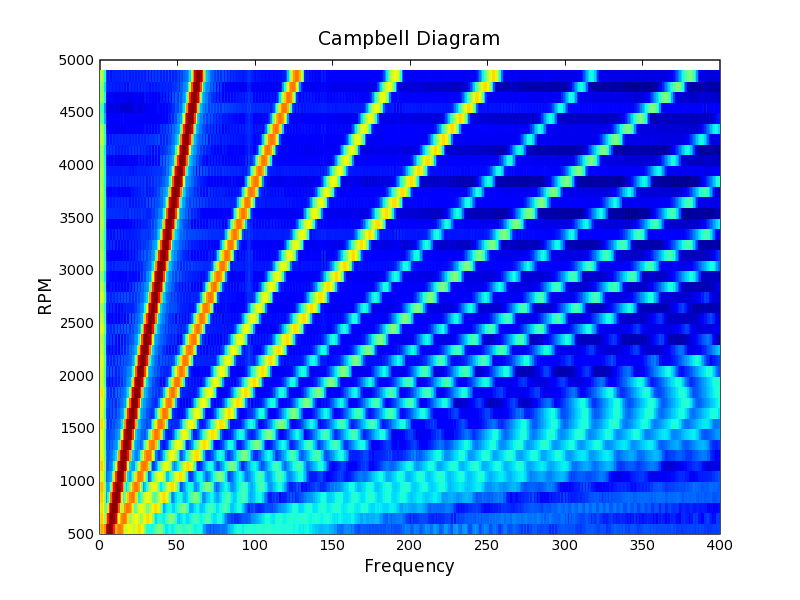
I'm getting great pcolor plots like attached one and learning lots
about it. So far so good. One minor question if you don't mind...
I'm getting an empty white strip across the top of attached plot
as you can see which led me deeper into workings of pcolor function.
It seems if your grid has 20 rows ( different y values) of points
that you won't get 20 colored horizontal strips but rather
*19*. This is because we must lose one row to specify the top
and/or bottom EDGE of the plot.... so XX rows means (XX-1) rows
of colored squares.
Please tell me if this is right but more importantly, how to
most wisely remove the white horizontal strip from this
pcolor plot.
Thanks!
chris
