Hello,
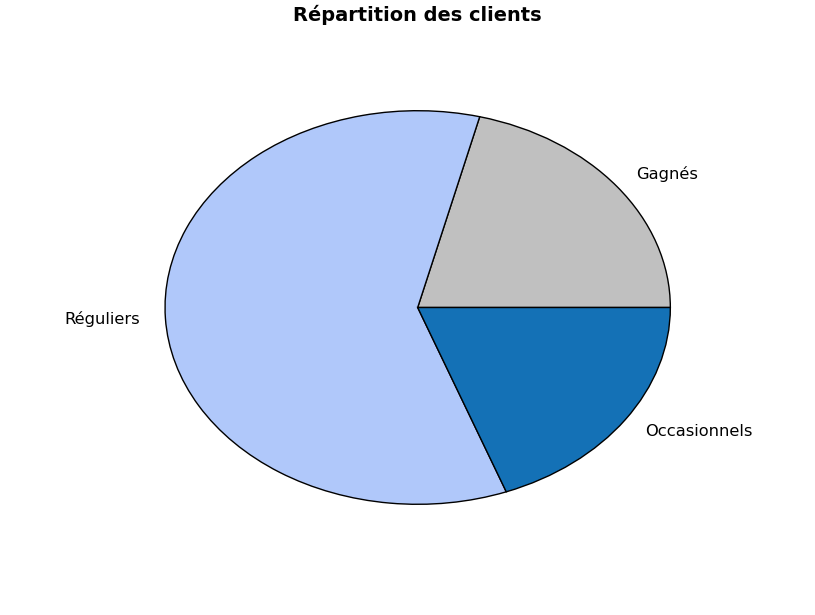
Pie charts are very useful, but when wedges labels are too long, the
label text overlaps the pie wedge, resulting in a poor readability
(see the attached file 'before_patch.pdf').
I propose to modify the file 'axes.py' in method 'pie' by replacing:
xt = x + labeldistance*radius*math.cos(thetam)
yt = y + labeldistance*radius*math.sin(thetam)
t = self.text(xt, yt, label,
size=rcParams['xtick.labelsize'],
horizontalalignment='center',
verticalalignment='center')
texts.append(t)
By:
xt = x + labeldistance*radius*math.cos(thetam)
yt = y + labeldistance*radius*math.sin(thetam)
label_alignment = xt > 0 and 'left' or 'right'
t = self.text(xt, yt, label,
size=rcParams['xtick.labelsize'],
horizontalalignment=label_alignment,
verticalalignment='center')
texts.append(t)
Only 2 lines changed 
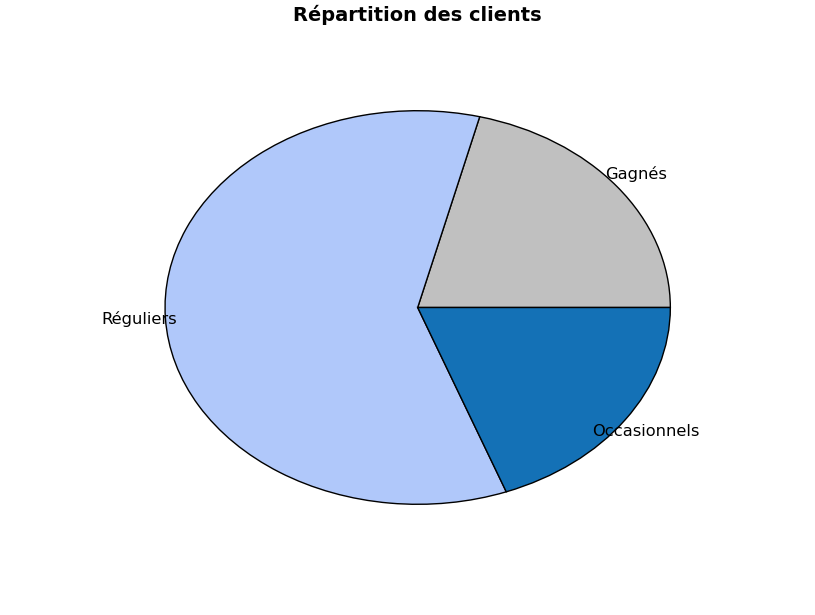
This way, labels are right aligned when placed at the left of the pie,
and left aligned when placed on the right of the pie (instead of being
always centered). See the attached file 'after_patch.pdf' for an
example.
I also give an example in the example.py file.
Do you agree to commit that to the trunk?
Thanks for making matplotlib,
Benoit Hirbec
Garden
example.py (417 Bytes)
Looks like a nice solution to me. I don't use pie charts much myself, so I'll give it some time to see if there are any dissenters. If none, I'll go ahead and commit this to SVN.
Thanks!
Mike
Benoit Hirbec wrote:
···
Hello,
Pie charts are very useful, but when wedges labels are too long, the
label text overlaps the pie wedge, resulting in a poor readability
(see the attached file 'before_patch.pdf').
I propose to modify the file 'axes.py' in method 'pie' by replacing:
xt = x + labeldistance*radius*math.cos(thetam)
yt = y + labeldistance*radius*math.sin(thetam)
t = self.text(xt, yt, label,
size=rcParams['xtick.labelsize'],
horizontalalignment='center',
verticalalignment='center')
texts.append(t)
By:
xt = x + labeldistance*radius*math.cos(thetam)
yt = y + labeldistance*radius*math.sin(thetam)
label_alignment = xt > 0 and 'left' or 'right'
t = self.text(xt, yt, label,
size=rcParams['xtick.labelsize'],
horizontalalignment=label_alignment,
verticalalignment='center')
texts.append(t)
Only 2 lines changed 
This way, labels are right aligned when placed at the left of the pie,
and left aligned when placed on the right of the pie (instead of being
always centered). See the attached file 'after_patch.pdf' for an
example.
I also give an example in the example.py file.
Do you agree to commit that to the trunk?
Thanks for making matplotlib,
Benoit Hirbec
Garden
------------------------------------------------------------------------
------------------------------------------------------------------------
------------------------------------------------------------------------
-------------------------------------------------------------------------
Check out the new SourceForge.net Marketplace.
It's the best place to buy or sell services for
just about anything Open Source.
http://sourceforge.net/services/buy/index.php
------------------------------------------------------------------------
_______________________________________________
Matplotlib-devel mailing list
Matplotlib-devel@lists.sourceforge.net
matplotlib-devel List Signup and Options
--
Michael Droettboom
Science Software Branch
Operations and Engineering Division
Space Telescope Science Institute
Operated by AURA for NASA
Thanks. This has been committed to the SVN trunk r5502.
Cheers,
Mike
Michael Droettboom wrote:
···
Looks like a nice solution to me. I don't use pie charts much myself, so I'll give it some time to see if there are any dissenters. If none, I'll go ahead and commit this to SVN.
Thanks!
Mike
Benoit Hirbec wrote:
Hello,
Pie charts are very useful, but when wedges labels are too long, the
label text overlaps the pie wedge, resulting in a poor readability
(see the attached file 'before_patch.pdf').
I propose to modify the file 'axes.py' in method 'pie' by replacing:
xt = x + labeldistance*radius*math.cos(thetam)
yt = y + labeldistance*radius*math.sin(thetam)
t = self.text(xt, yt, label,
size=rcParams['xtick.labelsize'],
horizontalalignment='center',
verticalalignment='center')
texts.append(t)
By:
xt = x + labeldistance*radius*math.cos(thetam)
yt = y + labeldistance*radius*math.sin(thetam)
label_alignment = xt > 0 and 'left' or 'right'
t = self.text(xt, yt, label,
size=rcParams['xtick.labelsize'],
horizontalalignment=label_alignment,
verticalalignment='center')
texts.append(t)
Only 2 lines changed
This way, labels are right aligned when placed at the left of the pie,
and left aligned when placed on the right of the pie (instead of being
always centered). See the attached file 'after_patch.pdf' for an
example.
I also give an example in the example.py file.
Do you agree to commit that to the trunk?
Thanks for making matplotlib,
Benoit Hirbec
Garden
------------------------------------------------------------------------
------------------------------------------------------------------------
------------------------------------------------------------------------
-------------------------------------------------------------------------
Check out the new SourceForge.net Marketplace.
It's the best place to buy or sell services for
just about anything Open Source.
http://sourceforge.net/services/buy/index.php
------------------------------------------------------------------------
_______________________________________________
Matplotlib-devel mailing list
Matplotlib-devel@lists.sourceforge.net
matplotlib-devel List Signup and Options
--
Michael Droettboom
Science Software Branch
Operations and Engineering Division
Space Telescope Science Institute
Operated by AURA for NASA