Hello,
I am reposting this query in the hopes that someone might have a new insight or can direct me to someone who would be willing to lend some assistance to solve the problem.
Thank you in advance for any assistance rendered. 
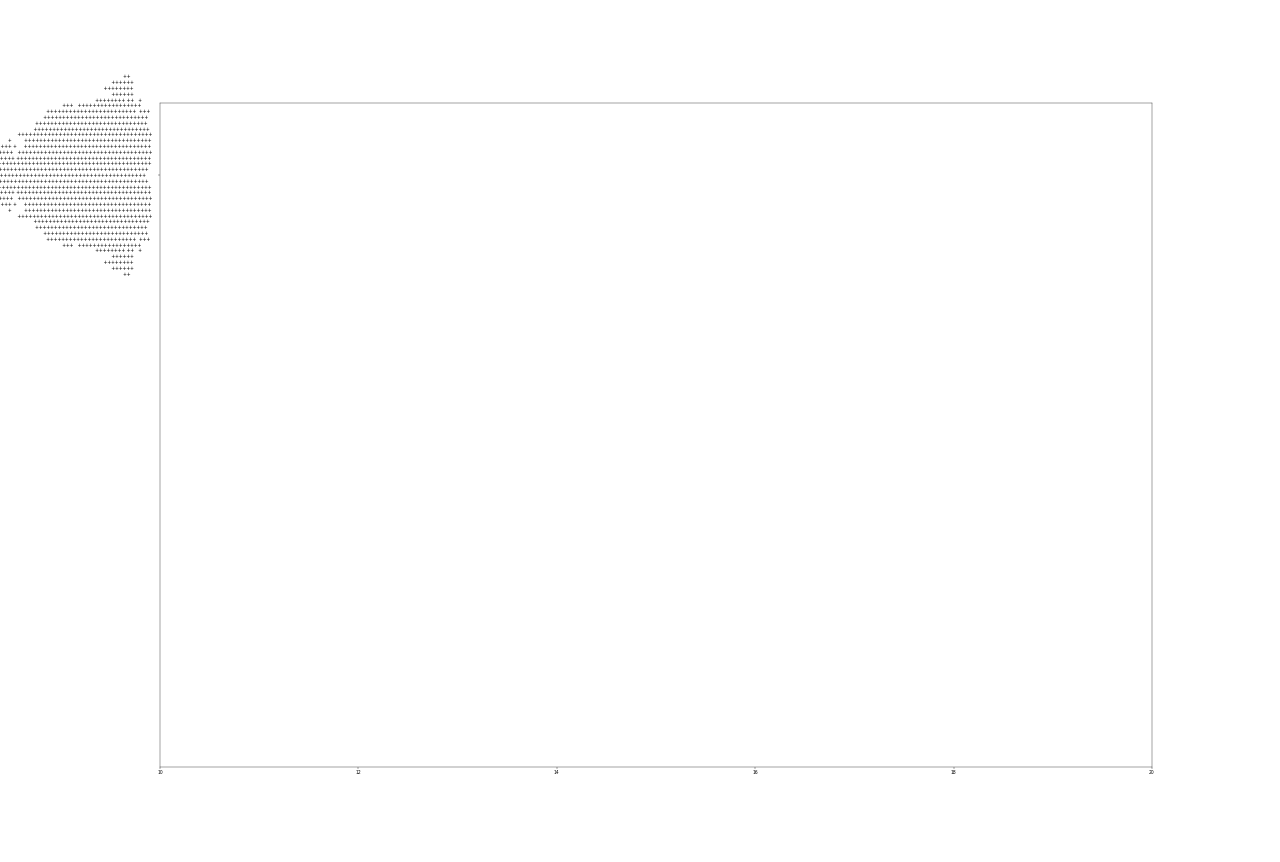
The problem is still that I cannot get Matplotlib to plot the figure inside the XY Axis. You can see from the images that the figure is treated like a Y-label, which it is not. I can move the figure up and down the Y-axis by varying the y values in the xy coordinates.
Below please see the images posted. Thank you
Here is my code:
from matplotlib import pyplot as plt from functools import reduce
fig, ax = plt.subplots(figsize=(28,16), dpi=32)
def mandelbrot(a):
return reduce(lambda z, _:z * z + a, range(50), 0)
def step(start, step, iterations):
return (start + (i * step) for i in range(iterations))
rows = (("*" if abs(mandelbrot(complex(x, y))) < 2 else " "
for x in step(-2.0, .0315, 80))
for y in step(1, -.05, 41))
rowjoin = ("\n".join("".join(row) for row in rows))
print("\n".join("".join(row) for row in rows))
ax.axis([1, 60, -60, 60])
ax.plot(rowjoin)
plt.show()


