Hello,
I'm not sure of the correct way to ask this question.....I'm trying to
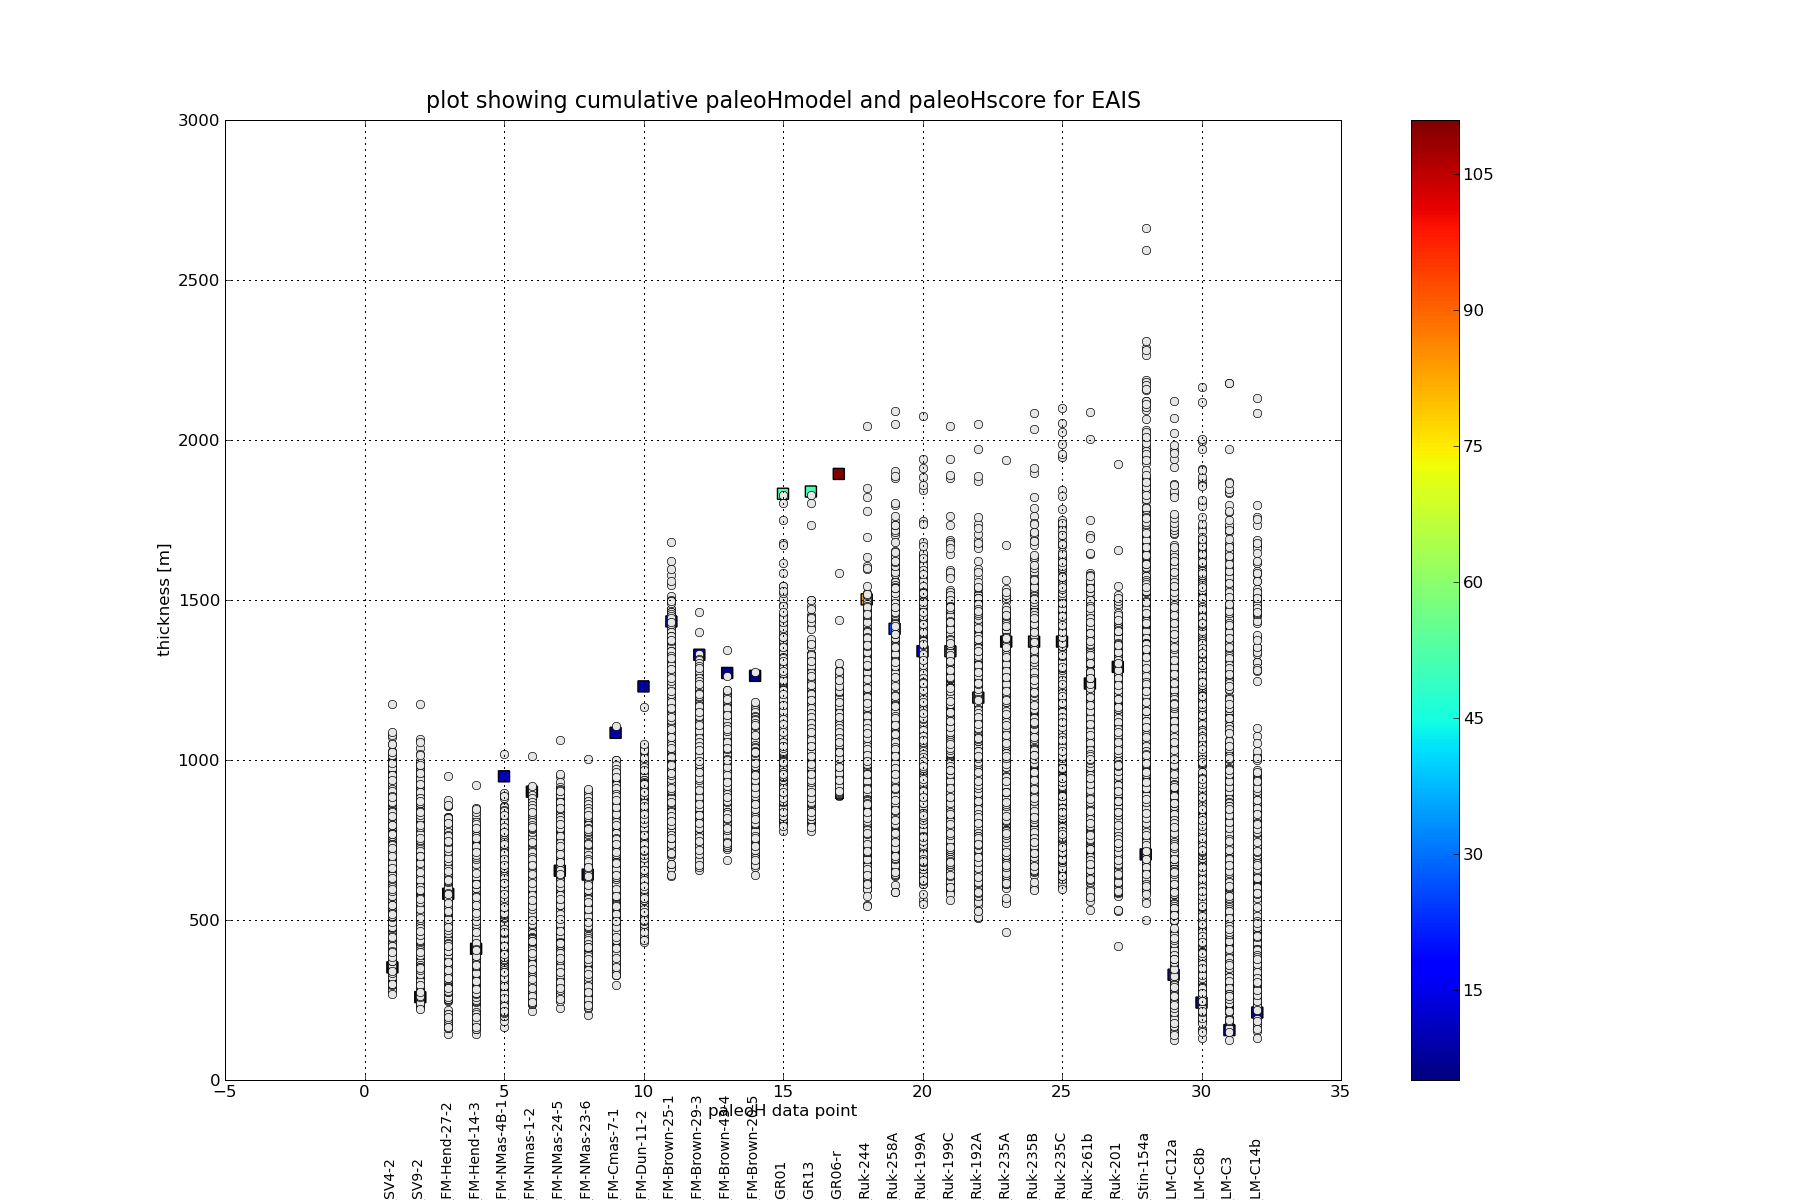
create a plot that has a number of layers. I plot a standard plot, then
a scatterplot over that. See attachment. I expected the scatter plot to
'render/draw' after the standard plot command, but the scatter plot data
is buried under the standard command.
I tried changing the order, i.e. scatterplot first but that had no
effect. How do I ensure the scatterplot data is plotted above/over the
other data?
The following code extract is after all the data has been read and
sorted.
# start plotting
plt.close()
# first EAIS data
stitle = 'plot showing cumulative paleoHmodel and paleoHscore for EAIS'
# set up index range for plotting
il=0 # index for lower bound to plot
iu=idx_splt # index for upper bound to plot
fig = plt.figure(5,figsize=(18,12))
ax1 = fig.add_subplot(111)
plt.title(stitle, fontsize=16)
plt.xlabel("paleoH data point")
plt.ylabel("thickness [m]")
ii=np.empty(num_rows)
# plot the model results
for i in range(il,iu):
ii[:] = i+1
plt.plot(ii,a[:,i],'o',color='0.9')
# set axis limits
ymin=-1800
ymin=-500
ax1.set_xlim(il,iu+1)
top = 3000
bottom=-500
ax1.set_ylim(bottom, top)
# plot the labels
for i in range(il,iu):
plt.text(i+1,ymin,datn[i], horizontalalignment='center',
fontsize=10,rotation='vertical', verticalalignment='bottom')
#cmap = cm.get_cmap('PRGn', 10)
#cmap = cm.get_cmap('autumn_r', 100)
#cmap = cm.get_cmap('gray', 100)
#plt.scatter(obs[il:iu,0],obs[il:iu,1],c=time[il:iu],marker='s',s=50,cmap=cmap)
plt.scatter(obs[il:iu,0], obs[il:iu,1], c=time[il:iu],marker='s',s=100)
plt.colorbar()
# plot the observation dp with error bars
#plt.errorbar(obs[il:iu,0], obs[il:iu,1], yerr=obs[il:iu,2], fmt='r.')
plt.grid(which='both')
fname="scoreVSpaleoHsite.png"
plt.savefig(fname)
plt.show()
Regards
Rob
This electronic communication is governed by the terms and conditions at
http://www.mun.ca/cc/policies/electronic_communications_disclaimer_2011.php