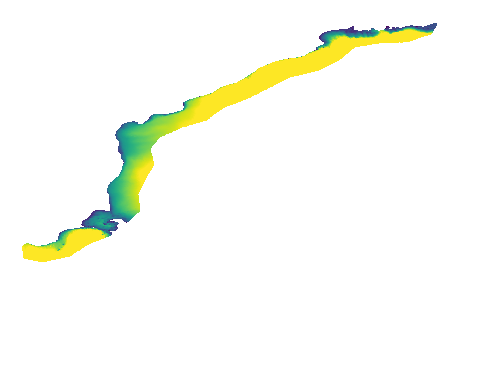
I have unstructured data i want to make geotiff plot using triangulation(trimesh). I am able to generate png plot but i want to generate geotiff, Can you please let me know how to generate geotiff plot in python. I want GEOTIFF using rasterio or matplotlib or other module, My code you can find below which is generating png matplotlib plot.
```
def plot():
    import matplotlib.tri as mtri
    import numpy as np
    import pandas as pd
    import matplotlib.pyplot as plt

    # Some points defining a triangulation over (roughly) Britain.
    xy = np.asarray([
        [-0.101, 0.872], [-0.080, 0.883], [-0.069, 0.888], [-0.054, 0.890],
        [-0.045, 0.897], [-0.057, 0.895], [-0.073, 0.900], [-0.087, 0.898],
        [-0.090, 0.904], [-0.069, 0.907], [-0.069, 0.921], [-0.080, 0.919],
        [-0.073, 0.928], [-0.052, 0.930], [-0.048, 0.942], [-0.062, 0.949],
        [-0.054, 0.958], [-0.069, 0.954], [-0.087, 0.952], [-0.087, 0.959],
        [-0.080, 0.966], [-0.085, 0.973], [-0.087, 0.965], [-0.097, 0.965],
        [-0.097, 0.975], [-0.092, 0.984], [-0.101, 0.980], [-0.108, 0.980],
        [-0.104, 0.987], [-0.102, 0.993], [-0.115, 1.001], [-0.099, 0.996],
        [-0.101, 1.007], [-0.090, 1.010], [-0.087, 1.021], [-0.069, 1.021],
        [-0.052, 1.022], [-0.052, 1.017], [-0.069, 1.010], [-0.064, 1.005],
        [-0.048, 1.005], [-0.031, 1.005], [-0.031, 0.996], [-0.040, 0.987],
        [-0.045, 0.980], [-0.052, 0.975], [-0.040, 0.973], [-0.026, 0.968],
        [-0.020, 0.954], [-0.006, 0.947], [0.003, 0.935], [0.006, 0.926],
        [0.005, 0.921], [0.022, 0.923], [0.033, 0.912], [0.029, 0.905],
        [0.017, 0.900], [0.012, 0.895], [0.027, 0.893], [0.019, 0.886],
        [0.001, 0.883], [-0.012, 0.884], [-0.029, 0.883], [-0.038, 0.879],
        [-0.057, 0.881], [-0.062, 0.876], [-0.078, 0.876], [-0.087, 0.872],
        [-0.030, 0.907], [-0.007, 0.905], [-0.057, 0.916], [-0.025, 0.933],
        [-0.077, 0.990], [-0.059, 0.993]])
    # Make lats + lons
    x = abs(xy[:, 0] * 180 / 3.14159)
    y = xy[:, 1] * 180 / 3.14159

    # A selected triangulation of the points.
    triangles = np.asarray([
        [67, 66, 1], [65, 2, 66], [1, 66, 2], [64, 2, 65], [63, 3, 64],
        [60, 59, 57], [2, 64, 3], [3, 63, 4], [0, 67, 1], [62, 4, 63],
        [57, 59, 56], [59, 58, 56], [61, 60, 69], [57, 69, 60], [4, 62, 68],
        [6, 5, 9], [61, 68, 62], [69, 68, 61], [9, 5, 70], [6, 8, 7],
        [4, 70, 5], [8, 6, 9], [56, 69, 57], [69, 56, 52], [70, 10, 9],
        [54, 53, 55], [56, 55, 53], [68, 70, 4], [52, 56, 53], [11, 10, 12],
        [69, 71, 68], [68, 13, 70], [10, 70, 13], [51, 50, 52], [13, 68, 71],
        [52, 71, 69], [12, 10, 13], [71, 52, 50], [71, 14, 13], [50, 49, 71],
        [49, 48, 71], [14, 16, 15], [14, 71, 48], [17, 19, 18], [17, 20, 19],
        [48, 16, 14], [48, 47, 16], [47, 46, 16], [16, 46, 45], [23, 22, 24],
        [21, 24, 22], [17, 16, 45], [20, 17, 45], [21, 25, 24], [27, 26, 28],
        [20, 72, 21], [25, 21, 72], [45, 72, 20], [25, 28, 26], [44, 73, 45],
        [72, 45, 73], [28, 25, 29], [29, 25, 31], [43, 73, 44], [73, 43, 40],
        [72, 73, 39], [72, 31, 25], [42, 40, 43], [31, 30, 29], [39, 73, 40],
        [42, 41, 40], [72, 33, 31], [32, 31, 33], [39, 38, 72], [33, 72, 38],
        [33, 38, 34], [37, 35, 38], [34, 38, 35], [35, 37, 36]])
    z = np.random.uniform(0, 16, 74)
    triangles = np.asarray([
        [67, 66, 1], [65, 2, 66], [1, 66, 2], [64, 2, 65], [63, 3, 64],
        [60, 59, 57], [2, 64, 3], [3, 63, 4], [0, 67, 1], [62, 4, 63],
        [57, 59, 56], [59, 58, 56], [61, 60, 69], [57, 69, 60], [4, 62, 68],
        [6, 5, 9], [61, 68, 62], [69, 68, 61], [9, 5, 70], [6, 8, 7],
        [4, 70, 5], [8, 6, 9], [56, 69, 57], [69, 56, 52], [70, 10, 9],
        [54, 53, 55], [56, 55, 53], [68, 70, 4], [52, 56, 53], [11, 10, 12],
        [69, 71, 68], [68, 13, 70], [10, 70, 13], [51, 50, 52], [13, 68, 71],
        [52, 71, 69], [12, 10, 13], [71, 52, 50], [71, 14, 13], [50, 49, 71],
        [49, 48, 71], [14, 16, 15], [14, 71, 48], [17, 19, 18], [17, 20, 19],
        [48, 16, 14], [48, 47, 16], [47, 46, 16], [16, 46, 45], [23, 22, 24],
        [21, 24, 22], [17, 16, 45], [20, 17, 45], [21, 25, 24], [27, 26, 28],
        [20, 72, 21], [25, 21, 72], [45, 72, 20], [25, 28, 26], [44, 73, 45],
        [72, 45, 73], [28, 25, 29], [29, 25, 31], [43, 73, 44], [73, 43, 40],
        [72, 73, 39], [72, 31, 25], [42, 40, 43], [31, 30, 29], [39, 73, 40],
        [42, 41, 40], [72, 33, 31], [32, 31, 33], [39, 38, 72], [33, 72, 38],
        [33, 38, 34], [37, 35, 38], [34, 38, 35], [35, 37, 36]])
    x = abs(xy[:, 0] * 180 / 3.14159)
    y = xy[:, 1] * 180 / 3.14159

    triang = mtri.Triangulation(x, y, triangles=triangles)
    print("type(triang):", triang)
    print("type(z):", type(z))

    ax=plt.tripcolor(triang,z,vmin=0,vmax=2)
    ax
    plt.show(ax)
    plt.savefig(ax,"ax.png")
plot()
```
Thank You