Novice question: Am I using pyplot.rgrids correctly?

I am a matplotlib.pyplot novice, but I have looked through various FAQs to no avail.

I am plotting a polar graph with some negative values of r. Everything goes well until I try to use rgrids(). Am I doing something wrong?

I attach some demo scripts and their outputs.

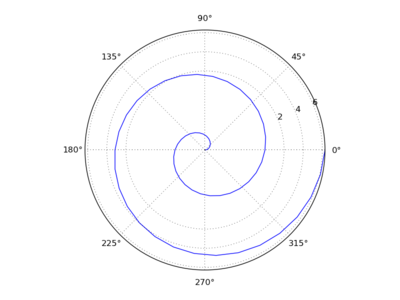
version1.py uses rgrid() but only has positive values of r. Everything works the way I expect it to (see version1.png).

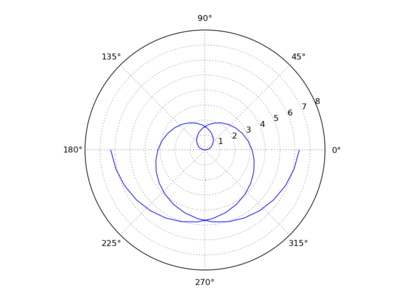
version2.py has negative values of r and the same call to rgrid() and misbehaves (see version2.png).

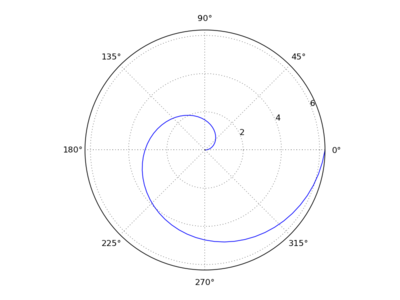
version3.py is the same as version2.py, but without the call to rgrids() (but with negative values of r). Again everything is as expected.

What am I doing wrong in version2.py?

version1.png

version1.py (207 Bytes)

version2.png

version2.py (217 Bytes)

version3.png

version3.py (219 Bytes)

Hi Bob,

I am a matplotlib.pyplot novice, but I have looked through various FAQs to no avail.

I am plotting a polar graph with some negative values of r. Everything goes well until I try to use rgrids(). Am I doing something wrong?

I attach some demo scripts and their outputs.

version1.py uses rgrid() but only has positive values of r. Everything works the way I expect it to (see version1.png).

version2.py has negative values of r and the same call to rgrid() and misbehaves (see version2.png).

version3.py is the same as version2.py, but without the call to rgrids() (but with negative values of r). Again everything is as expected.

What am I doing wrong in version2.py?

I am not sure why things work in version 3 and do not work in version 2. A guess would be how matplotlib is covering up illegal values of your "r" coordinate. Here I am only speaking from the math point of view, and not what is actually happening in matplotlib. I tired finding info in the docs, but did not succeed in getting

The coordinates "t" and "r" are angle and radius. In polar coordinates, negative values of the radial coordinate "r" are not well defined, since in this coordinate system, you can not have negative values of a radius.

So my **guess** is that your problems are related to this ill definition of the radial coordinate. And that sometimes matplotlib can cover it up for you, and other times it complains more loudly.

Regards,

Andre

I am a matplotlib.pyplot novice, but I have looked through various FAQs to no avail.

I am plotting a polar graph with some negative values of r. Everything goes well until I try to use rgrids(). Am I doing something wrong?

I attach some demo scripts and their outputs.

version1.py uses rgrid() but only has positive values of r. Everything works the way I expect it to (see version1.png).

version2.py has negative values of r and the same call to rgrid() and misbehaves (see version2.png).

version3.py is the same as version2.py, but without the call to rgrids() (but with negative values of r). Again everything is as expected.

What am I doing wrong in version2.py?

and only because it (sadly) took me a few minutes to figure out (even though it seemed so obvious), to create the plot of your version 3, with only positively defined values for "r", you can do

t = numpy.linspace(0,2*numpy.pi,61)
r = t
t2 = numpy.linspace(-numpy.pi,numpy.pi,61)
r2 = numpy.pi - t2

plt.polar(t,r)
plt.polar(t2,r2)

andre

Hi Bob,

I am plotting a polar graph with some negative values of r.
Everything goes well until I try to use rgrids(). Am I doing
something wrong?

I just noticed that calling rgrids *after* plotting works nicely for me:

subplot(111, polar=True)
polar(t, r)
rgrids([2,4,6])

However, calling rgrids before plotting indeed leads to a weird
situation where only half of the curve is plotted. After digging in the
source code, this may relate to the `use_rmin` parameter in the
PolarTransform class init (in matplotlib.projections.polar)

In the tranform_non_affine method I see
# line 40-42:
        if self._axis is not None:
            if self._use_rmin:
                rmin = self._axis.viewLim.ymin
# [...]
        if rmin != 0:
            r = r - rmin
            mask = r < 0
            x[:] = np.where(mask, np.nan, r * np.cos(t))
            y[:] = np.where(mask, np.nan, r * np.sin(t))
        else:
            x[:] = r * np.cos(t)
            y[:] = r * np.sin(t)

Maybe this the code behind the masking of half your curve, but I don't
know more.

Best,
Pierre

···

Le 17/12/2012 19:09, Bob Dowling a écrit :

Looking closer at the plot, the curve is actually not masked !

Actually the "rmin functionality' is activated with rmin=-2*pi so that
the whole r-axis is offset by +2pi. The plot is therefore pretty
consistent only it is not what you want, I guess.
I don't know how to disable this radius offset functionality.

Best,
Pierre

···

Le 17/12/2012 21:59, Pierre Haessig a écrit :

Maybe this the code behind the masking of half your curve, but I don't
know more.

Hi Pierre, Bob and all,

I reiterate that in polar coordinates, a negative value of "r" does not make sense. It is confusing at best.

At the very least, I think matplotlib should raise a NOISY warning. (I just checked that it does not).

I would advocate for a change however. I suggest that given negative values of "r", pyplot.polar raises an error and exits. One could add a kwarg that allows you to override this default behavior, "neg_r=False" unless the user specifies otherwise.

In general, when I code things that don't make sense mathematically, I like it when the code tells me I made a dumb mistake. If the code is defaulting to "fixing" the dumb mistake for me without any explicit warnings, that is more likely to raise a more serious error in my code, and a much harder bug to track down.

My two cents (well, it looks like a bit more than two).

Regards,

Andre

···

On Dec 17, 2012, at 1:12 PM, Pierre Haessig wrote:

Le 17/12/2012 21:59, Pierre Haessig a écrit :

Maybe this the code behind the masking of half your curve, but I don't
know more.

Looking closer at the plot, the curve is actually not masked !

Actually the "rmin functionality' is activated with rmin=-2*pi so that
the whole r-axis is offset by +2pi. The plot is therefore pretty
consistent only it is not what you want, I guess.
I don't know how to disable this radius offset functionality.

This isn't really true. Many standard introductions to polar coordinates consider negative r as valid. It's simply treated as a radius in the opposite direction (i.e., the point is reflected about the origin). A few examples found by googling: http://tutorial.math.lamar.edu/Classes/CalcII/PolarCoordinates.aspx and http://sites.csn.edu/istewart/mathweb/math127/intro_polar/intro_polar.htm and an MIT Opencourseware document at http://ocw.mit.edu/resources/res-18-001-calculus-online-textbook-spring-2005/study-guide/MITRES_18_001_guide9.pdf.

  Matplotlib shouldn't raise an error on negative r, it should just interpret negative r values correctly.

···

On 2012-12-17 14:36, Andre' Walker-Loud wrote:

On Dec 17, 2012, at 1:12 PM, Pierre Haessig wrote:

Le 17/12/2012 21:59, Pierre Haessig a écrit :

Maybe this the code behind the masking of half your curve, but I don't
know more.

Looking closer at the plot, the curve is actually not masked !

Actually the "rmin functionality' is activated with rmin=-2*pi so that
the whole r-axis is offset by +2pi. The plot is therefore pretty
consistent only it is not what you want, I guess.
I don't know how to disable this radius offset functionality.

Hi Pierre, Bob and all,

I reiterate that in polar coordinates, a negative value of "r" does not make sense. It is confusing at best.

--
Brendan Barnwell
"Do not follow where the path may lead. Go, instead, where there is no path, and leave a trail."
    --author unknown

I reiterate that in polar coordinates, a negative value of "r" does not make sense. It is confusing at best.

  This isn't really true. Many standard introductions to polar
coordinates consider negative r as valid. It's simply treated as a
radius in the opposite direction

In Euclidean space, can you have a negative distance? Would you ever describe a circle as having negative radius (in Euclidean space)? If you take "r" to be the radius, then I suggest you confuse a precise definition of radius with allowing a useful, non-unique interpretation of negative values of "r".

(i.e., the point is reflected about
the origin). A few examples found by googling:
http://tutorial.math.lamar.edu/Classes/CalcII/PolarCoordinates.aspx
and
http://sites.csn.edu/istewart/mathweb/math127/intro_polar/intro_polar.htm
and an MIT Opencourseware document at
http://ocw.mit.edu/resources/res-18-001-calculus-online-textbook-spring-2005/study-guide/MITRES_18_001_guide9.pdf.

The nice MIT notes you linked to state (sec. 9.2, (page 355) listed as 132 on the bottom of page)

"The polar equation r = F(theta) is like y = f(x). For each angle theta the equation tells us the distance r (which is not allowed to be negative)."

  Matplotlib shouldn't raise an error on negative r, it should just
interpret negative r values correctly.

You assume all people have chosen the same definition of how to interpret negative values of "r". I grant you that it may be useful in some contexts to define what it means to have negative values of "r". But this definition is NOT UNIQUE. However, if you take "r" as a radius, and hence a positive definite quantity, as you would expect in Euclidean geometry for a distance, and you allow

r: [0,inf]
theta: [0,2pi)

then there is a unique and unambiguous representation of the coordinates.

I am not arguing that one can not take a definition of negative "r", only that different users will expect different things, and what matplotlib choses to do is not readily accessible in the documents as far as I can see. I also argue that many users, coming from the scientific background, will naturally interpret "r" as the radius (as I do) and hence expect "r" to be positive definite. And lastly, I argue, that since the definition is not unique, and people have different expectations, at the very least, matplotlib should warn you how it is interpreting negative "r".

Regards,

Andre

I don't take r to be "the radius", I take it to be a number in an ordered pair with a particular mapping into R^2. It is an extension of the notion of radius, but there's no reason it has to conform with the restrictions on geometrically possible radii.

  However, those issues are beside the point. The point is that, regardless of what a radius is, in the context of polar coordinates, a negative *r-coordinate* is a perfectly mathematically respectable notion with a standard interpretation. Moreover, it is actually useful when you want to graph some things, and is supported by other plotting software (see, e.g., polar plot r=theta,-pi<r<0 - Wolfram|Alpha). Matplotlib should plot r-coordinates according to this standard interpretation,

···

On 2012-12-17 20:05, Andre' Walker-Loud wrote:

I reiterate that in polar coordinates, a negative value of "r"
does not make sense. It is confusing at best.

This isn't really true. Many standard introductions to polar
coordinates consider negative r as valid. It's simply treated as
a radius in the opposite direction

In Euclidean space, can you have a negative distance? Would you
ever describe a circle as having negative radius (in Euclidean
space)? If you take "r" to be the radius, then I suggest you
confuse a precise definition of radius with allowing a useful,
non-unique interpretation of negative values of "r".

--
Brendan Barnwell
"Do not follow where the path may lead. Go, instead, where there is no path, and leave a trail."
    --author unknown

Hi Brendan,

I reiterate that in polar coordinates, a negative value of "r"
does not make sense. It is confusing at best.

This isn't really true. Many standard introductions to polar
coordinates consider negative r as valid. It's simply treated as
a radius in the opposite direction

In Euclidean space, can you have a negative distance? Would you
ever describe a circle as having negative radius (in Euclidean
space)? If you take "r" to be the radius, then I suggest you
confuse a precise definition of radius with allowing a useful,
non-unique interpretation of negative values of "r".

  I don't take r to be "the radius", I take it to be a number in an ordered pair with a particular mapping into R^2. It is an extension of the notion of radius, but there's no reason it has to conform with the restrictions on geometrically possible radii.

This was clear from your previous comment - but this is precisely my point. In your original message, you used the word "radius". My point is that mathematics, and computing, are precise languages with hopefully unambiguous definitions. You used the word radius, but had in mind a less rigorous definition, because you were thinking of "r" as just one component of a two-coordinate description of 2D Euclidean space, with a specific definition of how to interpret negative "r". It is the standard you are used to and so not surprising to you. My point is that this expectation is not unique, and in my field, not common, and so not expected by me. Further, looking at the matplotlib doc, there is no indication what is happening - from

http://matplotlib.org/api/pyplot_api.html

matplotlib.pyplot.polar(*args, **kwargs)
Make a polar plot.
call signature:
polar(theta, r, **kwargs)
Multiple theta, r arguments are supported, with format strings, as in plot().

There is no mention in the docs about the treatment of negative "r". The treatment is contrary to my expectations, and I would wager contrary to many peoples expectations. So at a new minimum, at the very least, the docs should make clear what is happening.

I would further suggest that there are options specified by kwargs what the behavior is. The default could be the current behavior, which sounds like it is standard to some, and another option would be to complain if r < 0, as I think many others would expect.

Maybe I am totally off. Maybe I am the only one who does not expect r to go negative. But at least the behavior should be clear without having to dig into the code.

  However, those issues are beside the point. The point is that, regardless of what a radius is, in the context of polar coordinates, a negative *r-coordinate* is a perfectly mathematically respectable notion with a standard interpretation. Moreover, it is actually useful when you want to graph some things, and is supported by other plotting software (see, e.g., polar plot r=theta,-pi<r<0 - Wolfram|Alpha). Matplotlib should plot r-coordinates according to this standard interpretation,

Again, I would just argue the standard behavior should be clearly stated in the docs.

Regards,

Andre
Hi Andre,

There is no mention in the docs about the treatment of negative "r". The treatment is contrary to my expectations, and I would wager contrary to many peoples expectations. So at a new minimum, at the very least, the docs should make clear what is happening.

I would further suggest that there are options specified by kwargs what the behavior is. The default could be the current behavior, which sounds like it is standard to some, and another option would be to complain if r < 0, as I think many others would expect.

I fully agree with the idea of enabling users to specify the behavior
they want. I'm not sure about raising an error, but it's true that it
can be pretty helpful to detect computational mistakes.

The way polar plots are implemented now seems to be a generalization of
usual polar coordinate mapping. Indeed, we have in [1] the following
mapping (let's call it T) :

T : (r, θ) ⟶ ((r-rmin) cos(θ), (r-rmin) sin(θ) )

which is parametrized by rmin.
Currently this 'rmin' is get from the ymin property of axis.viewLim
which can be set by ax.set_lim(ymin=...)

I see this "radius offsetting" functionality pretty useful in some cases
like drawing antenna diagrams in dB like [2]. For such a usecase, a
radius (ie r-rmin) going negative could raise an error.

In some other usecases like with a polar rose [3], the radius going
negative (and indeed it may not be called radius anymore...) is
perfectly legitimate and is the expected behavior. Also, the mapping T
currently implemented in [1] supports it perfectly.

In conclusion, I think matplotlib in its currently almost perfectly(*)
able to deal with both use cases thanks to this parametrized polar
mapping T. However, the current state of the documentation doesn't
reflects this flexibility. Also, an additional keyword argument could
help to specify the expected behavior, especially in term of error raising.

Best,
Pierre

[1]

[2] https://hamstudy.org/browse/E4_2012/E9B
[3] Polar coordinate system - Wikipedia
(*) rgrids function raises an error for negative r values (see
polar.py#L537). This could be annoying for radiation patterns in dB

···

Le 18/12/2012 06:52, Andre' Walker-Loud a écrit :

This is causing so much fuss, I'm starting to feel bad about asking the question. I'll reply in the "uniqueness" thread about the (r,th) coordinate system from a mathematical perspective.

From a matplotlib.pyplot user perspective, however, I think that if it is going to misbehave with negative values of r under certain circumstances (rgrids() in this case) then it should produce a noisy warning as soon as it sees them in *all* circumstances. So my version2.py and version3.py should both produce warnings.

Any how, the answer seems to be "yes I'm using rgrids() correctly, but no I'm not using matplotlib-friendly data points". I shall adjust my values of (r,th).

Thank you for all your feedback.

You don't need to change your (r,th) values. The two workarounds I see
to get your "version2" script work are :

1) Either call rgrids *after* plotting :

subplot(111, polar=True)
polar(t, r)
rgrids([2,4,6])

2) or call ylim to change the "rmin" parameter which tunes the radius
offset :

subplot(111, polar=True)
rgrids([2,4,6])
polar(t, r)
ylim(ymin=0) # or ylim(0,8) which looks even better in your specific case

Best,
Pierre

···

Le 18/12/2012 11:13, Bob Dowling a écrit :

Any how, the answer seems to be "yes I'm using rgrids() correctly, but
no I'm not using matplotlib-friendly data points". I shall adjust my
values of (r,th).

Hi Pierre,

There is no mention in the docs about the treatment of negative "r". The treatment is contrary to my expectations, and I would wager contrary to many peoples expectations. So at a new minimum, at the very least, the docs should make clear what is happening.

I would further suggest that there are options specified by kwargs what the behavior is. The default could be the current behavior, which sounds like it is standard to some, and another option would be to complain if r < 0, as I think many others would expect.

I fully agree with the idea of enabling users to specify the behavior
they want. I'm not sure about raising an error, but it's true that it
can be pretty helpful to detect computational mistakes.

This (above) sums up why I would like to have the option of matplotlib error raising for negative values of r.
Just to set the scene, I come from a physics background. So for me, and any application I would have, r is interpreted as a radius bounded from [0,inf]. Otherwise, keeping track, for example, of the motion of an object in polar coordinates would be more difficult.
Constructing polar coordinates is not always obvious, and one can make a mistake. Especially with something like matplotlib, where it is easy to experiment, sometimes one just throws the parameterization at the computer and sees what comes out.

From this perspective, it would be nice if I were to get a warning or error message.
I am perfectly happy to have the default behavior remain what it is.

I wish I were in a position to actually contribute to adding this new option. At the moment, I am in the midst of job hunting season, and would not be able to attempt it for a few months. If no one has taken up the task by then, and a developer were willing to look over my shoulder now and then, I would be interested in trying to add such an option. I have not yet contributed in such a way.

Regards,

Andre