Hi,
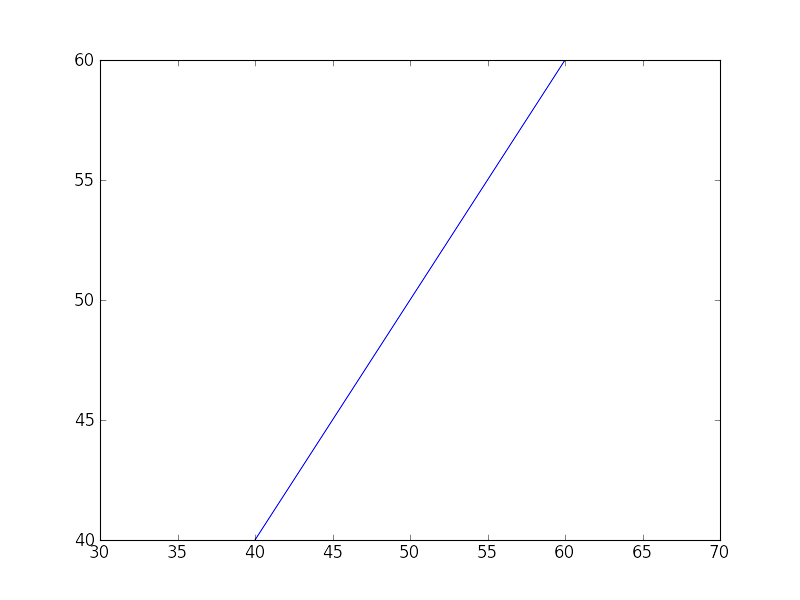
when i have a dataset that covers an area larger than the area i want
to show in my plot, then it should be clipped to the ranges i set to the
axes (at least that is what i am expecting). when i do so and save the
plot to a png-file everything is fine. but if i save it to an svg file,
the plot is not clipped to the plot area. did i do something wrong in
the code below or is it just a bug in the svg-backend?
import matplotlib.pyplot as plt
xData = range(0,100)
yData = range(0,100)
ax = plt.axes()
ax.set_xlim(30,70)
ax.set_ylim(40,60)
plt.plot(xData,yData)
plt.savefig("test.svg", format='svg', transparent=True)
plt.savefig("test.png", format='png', transparent=True)

···
--
Regards
Sebastian Ohl
--
Sebastian Ohl sebastian@...4030...
Kurzekampstr. 14 Tel +49 531 7998221
D-38104 Braunschweig Mobil +49 172 1837678