[newbie] 2 problems: a) CJK, b) adding letters to points

Hello everyone,

I hope you can help me with two problems I am struggling with. The second question, I imagine, should be rather easy, but I wasn't able to figure it out by googling.

a) My graph will have Chinese labels, however mpl does not render the Chinese characters. I was unable to find how to teach it some CJK. Could you please indicate what the approach to be followed is?

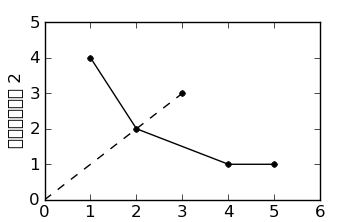
Also, the xlabel is not shown when sizing/saving the graph at (3.6, 2.22) inches. Why is that? And how can I make mpl show the xlabel?

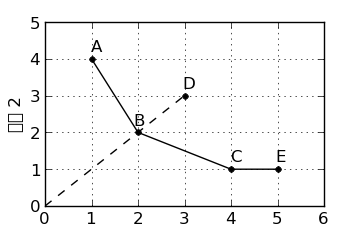
b) In the file dea.png (attached) you can see that data points are rendered by points ('ko'). Each of these points has an associated name; for example, point (1,4) is 'A'. This name, 'A', should be incorporated into the graph so as to identify the point. 'A' should be placed right next to the dot. Could you please let me know what the easiest way is to solve this problem?

Thank you very much for your help!

David

dea.py (484 Bytes)
dea.png

Hello everyone,

I hope you can help me with two problems I am struggling with. The second question, I imagine, should be rather easy, but I wasn’t able to figure it out by googling.

a) My graph will have Chinese labels, however mpl does not render the Chinese characters. I was unable to find how to teach it some CJK. Could you please indicate what the approach to be followed is?

Probably you need a unicode font-set that contain all the characters for those alphabets. You can look at this example to see a simple unicode demonstration example. http://matplotlib.sourceforge.net/examples/pylab_examples/unicode_demo.html

Make sure you are using the right font in your matplotlib.

Also, the xlabel is not shown when sizing/saving the graph at (3.6, 2.22) inches. Why is that? And how can I make mpl show the xlabel?

You have to adjust your label to get it seen. You may try with:

xlab = plt.xlabel(“my x-axes label”)
xlab.set_position((0.2, 0.1))

b) In the file dea.png (attached) you can see that data points are rendered by points (‘ko’). Each of these points has an associated name; for example, point (1,4) is ‘A’. This name, ‘A’, should be incorporated into the graph so as to identify the point. ‘A’ should be placed right next to the dot. Could you please let me know what the easiest way is to solve this problem?

Two ways I can think of are: annotate and text functions of pyplot api. http://matplotlib.sourceforge.net/api/pyplot_api.html

Let me know if these work fine for you.

···

On Mon, Mar 15, 2010 at 6:18 PM, David <ldl08@…361…> wrote:

Thank you very much for your help!

David


Download Intel® Parallel Studio Eval

Try the new software tools for yourself. Speed compiling, find bugs

proactively, and fine-tune applications for parallel performance.

See why Intel Parallel Studio got high marks during beta.

http://p.sf.net/sfu/intel-sw-dev


Matplotlib-users mailing list

Matplotlib-users@lists.sourceforge.net

https://lists.sourceforge.net/lists/listinfo/matplotlib-users


Gökhan

Dear Gökhan,

thanks a lot for your reply and help! I could solve some of my problems, others remain elusive.

Probably you need a unicode font-set that contain all the characters for
those alphabets. You can look at this example to see a simple unicode
demonstration example.

Yes, I have done that, for example:

ylab = plt.ylabel(u'输入 2')

Make sure you are using the right font in your matplotlib.

Well, here I get stuck. I checked the fontList.cache, and all the relevant CJK fonts are listed in there.
I then added some CJK font names to my /etc/matplotlibrc: (I am using Ubuntu 9.10)

#font.sans-serif : SimHei, Adobe Song Std, Bitstream Vera Sans, ...
#font.cursive : Apple Chancery, ...
#font.fantasy : Comic Sans MS, ...
#font.monospace : Adobe Fangsong Std, Bitstream Vera Sans Mono, ...

In addition, I also defined

rcParams['font.sans-serif'] = ['SimHei']

in my Python code (attached).

All to no avail. I am at a loss. I would greatly appreciate some help here!

You have to adjust your label to get it seen. You may try with:

xlab = plt.xlabel("my x-axes label")
xlab.set_position((0.2, 0.1))

This did not yield any results. With the above code, xlab.set_position((0.2, 0.1)), I change the position of the xlabel.
But the problem is that my graph is cut before the xlabel has a chance to appear (see dea.png). Basically the graph ends right after the x-axis. What I thus need is more whitespace under my x-axis. But how?

Two ways I can think of are: annotate and text functions of pyplot api.
http://matplotlib.sourceforge.net/api/pyplot_api.html

This worked fine! What I did was to define

text( 1, 4.2, u'A')

etc.

Thanks for your ideas and insights!

David

dea.png

dea.py (921 Bytes)

···

On 16/03/10 07:59, Gökhan Sever wrote:

if you use tex for rendering text, see

http://matplotlib.sourceforge.net/users/usetex.html#usetex-with-unicode

If not, the best option I know of is to set the font name directly, see

http://old.nabble.com/Russian-labels-without-LaTeX-td24538302.html

Matplotlib does not support fontset, so you can only use glyphs in the
font you specified.

Regards,

-JJ

···

On Tue, Mar 16, 2010 at 3:30 AM, David <ldl08@...361...> wrote:

On 16/03/10 07:59, Gökhan Sever wrote:

Probably you need a unicode font-set that contain all the characters for
those alphabets. You can look at this example to see a simple unicode
demonstration example.

Yes, I have done that, for example:

ylab = plt.ylabel(u'输入 2')

adjust your subplot parameters.

plt.subplots_adjust(bottom=0.2)

see

http://matplotlib.sourceforge.net/faq/howto_faq.html#move-the-edge-of-an-axes-to-make-room-for-tick-labels

http://matplotlib.sourceforge.net/faq/howto_faq.html#automatically-make-room-for-tick-labels

-JJ

···

On Tue, Mar 16, 2010 at 3:30 AM, David <ldl08@...361...> wrote:

This did not yield any results. With the above code, xlab.set_position((0.2,
0.1)), I change the position of the xlabel.
But the problem is that my graph is cut before the xlabel has a chance to
appear (see dea.png). Basically the graph ends right after the x-axis. What
I thus need is more whitespace under my x-axis. But how?

Yep, that did the trick! thanks Jae-Joon and Gökhan!

David

···

On 16/03/10 20:39, Jae-Joon Lee wrote:
>
> adjust your subplot parameters.
>
> plt.subplots_adjust(bottom=0.2)