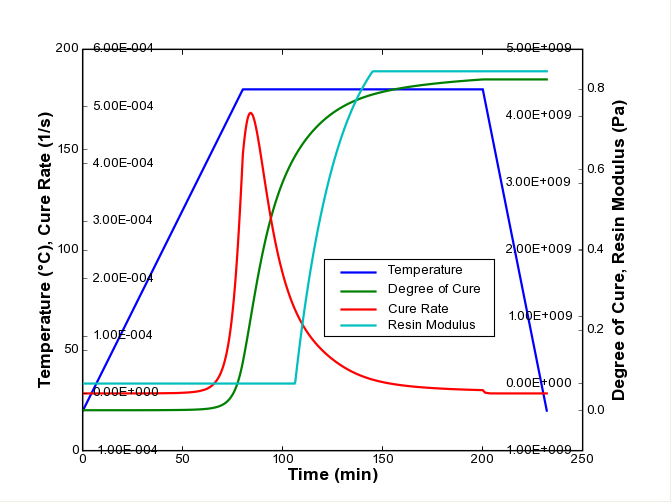
Hmmm, unsupported, but working. See attached. Maybe I've misunderstood,
though.
Anyway, I'm not complete sure of your context, but this plot was
generated in code, rather than using pylab. I don't use pylab and I
don't know if there's an analogue to what I'll describe below.
Unfortunately the code used to generate this particular chart is much
more than what you're looking for (our current matplotlib based "plot"
object is currently 1500 lines of code on top of MPL). It does,
however, allow me to plot a line on any of 4 independent "y" axes, and 2
"x" axes (and a bunch of other bells and whistles).
The underlying structure creates a "master" figure (X1Y1) and then
subsequent figures overlaid on top (ie in the same location by using
axes.get_position()). Each subsequent figure uses an appropriate
"sharex=" in the call figure.add_axes(...). Also significant are to
turn the frame off (frameon=False), and assign a label to each figure
(label='myLabel') so that MPL doesn't try to combine figures for you.
In principle, I don't see why this can't be done for an arbitrary number
of subfigures, but practically, the plot start getting cluttered and
confusing pretty quickly.
I can't post the code, but if you have some more questions, I can try to
help!
Cheers,
Anthony.
···
On 10/5/07, James Boyle <boyle5@...99...> wrote:
> I wish to plot 3 lines on a single graph - each line requires a
> separate y scaling but shares a common x.
> The case for 2 such lines is handled by twinx as in the
two_scales.py
> example.
>
> I have not found an example of 3 lines ( or greater). In
the case of
> more than 2 scales the y axis scale would have to float, to
the right
> or left of the y axes defined for the first 2 lines.This is on the wish list, but is currently unsupported.
JDH