Hi!
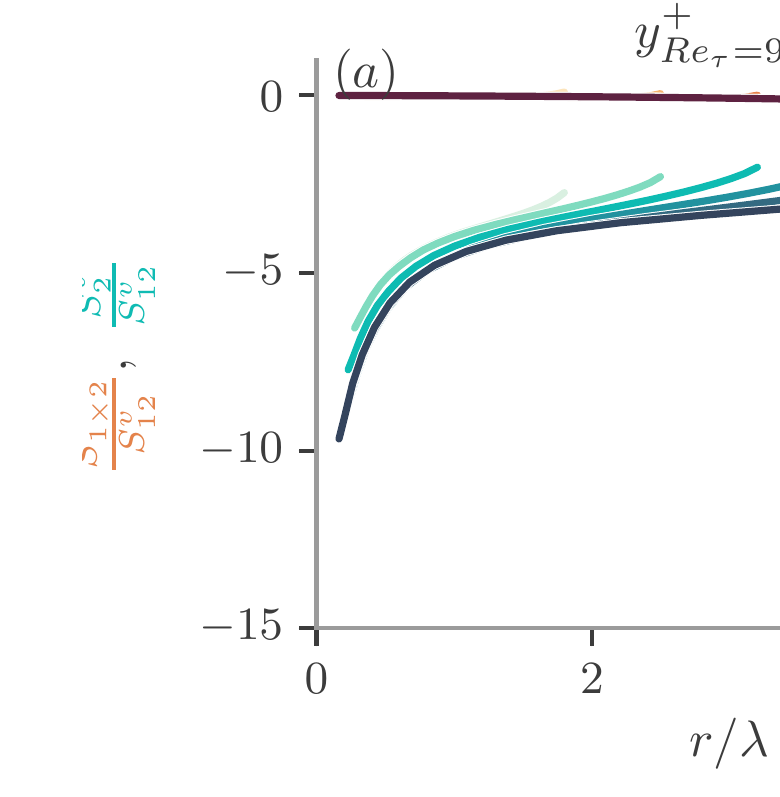
I want to have an axis label with different colours for different strings. One solution is to use the ‘pgf’ backend and put in my preamble the ‘xcolor’ package however, when I save to .eps my superscripts are cut off:
As I understand is due to this bug: [Bug]: bbox computed incorrectly when using a superscript · Issue #21653 · matplotlib/matplotlib · GitHub
One way to have correct alignment according to this comment: [Bug]: bbox and alignment issues with math text · Issue #22459 · matplotlib/matplotlib · GitHub is to use the new mplcairo backend. Is there a way to have a coloured axis label using the mplcairo backend?
Or is there any way to have the correct font alignment using the ‘pgf’ backend?
Thank you in advance!