Hi,
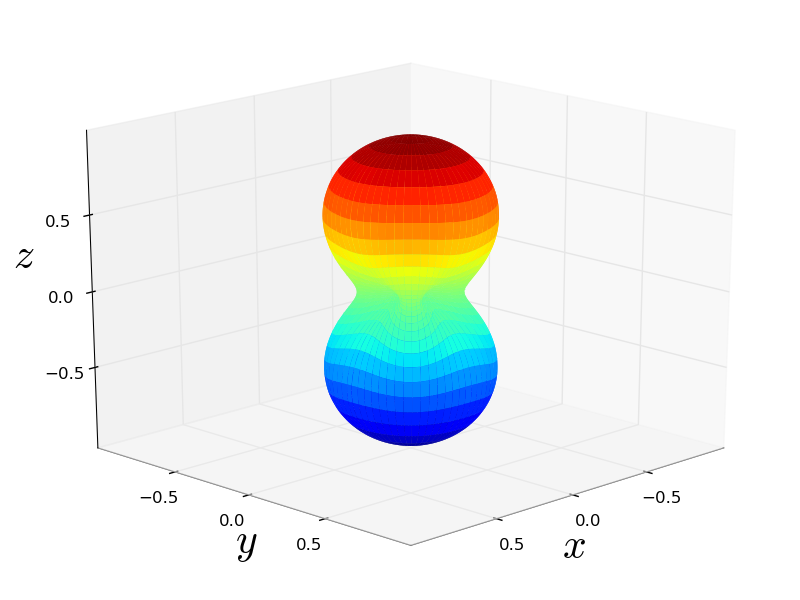
I have a nice plot_surface() using mplot3d (see attachement).
I’d like to project the surface on the axis xoy, xoz and yoz with a contour, similar to this figure:
http://homepages.ulb.ac.be/~dgonze/INFO/matlab/fig19.jpg
Is it possible using matplotlib and mplot3d?
Thanx!
Hello list,
I'm not an expert in axes3d, but in case the feature which Nicolas requested
is not possible in an easy manner up to now, I propose an additional kwarg
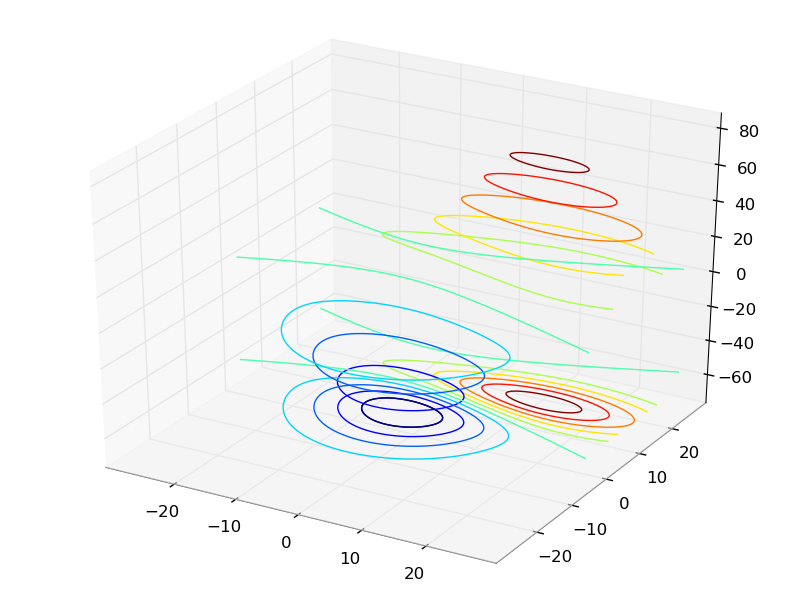
for axes3d.Axes3D.contour. Something like *offset*. If offset is None the
z-values of the contour lines corresponds to given Z and otherwise offset is
used for the z-values of the contour lines.
I attached a changed axes3d.py and a patch against current svn. The result is
illustrated in the contour3d_demo.png.
Could any of the experts have a look at it and tell me if this could be
useful, please?
Thanks in advance for any comments.
Kind regards
Matthias
axes3d_offset.patch (1.9 KB)
contour3d_demo.py (273 Bytes)
axes3d.py (32.2 KB)
···
On Wednesday 30 September 2009 19:22:42 Nicolas Bigaouette wrote:
Hi,
I have a nice plot_surface() using mplot3d (see attachement).
I'd like to project the surface on the axis xoy, xoz and yoz with a
contour, similar to this figure:
http://homepages.ulb.ac.be/~dgonze/INFO/matlab/fig19.jpg
Is it possible using matplotlib and mplot3d?
Thanx!
Matthias Michler wrote:
Hello list,
I'm not an expert in axes3d, but in case the feature which Nicolas requested
is not possible in an easy manner up to now, I propose an additional kwarg
for axes3d.Axes3D.contour. Something like *offset*. If offset is None the
z-values of the contour lines corresponds to given Z and otherwise offset is
used for the z-values of the contour lines.
I attached a changed axes3d.py and a patch against current svn. The result is
illustrated in the contour3d_demo.png.
Could any of the experts have a look at it and tell me if this could be
useful, please?
Thanks in advance for any comments.
Kind regards
Matthias
Hi,
I have a nice plot_surface() using mplot3d (see attachement).
I'd like to project the surface on the axis xoy, xoz and yoz with a
contour, similar to this figure:
http://homepages.ulb.ac.be/~dgonze/INFO/matlab/fig19.jpg
Is it possible using matplotlib and mplot3d?
Thanx!
Hi Matthias,
I committed your patch to a github branch of MPL, but I'll let Reinier
actually commit something based on this to MPL.
http://github.com/astraw/matplotlib/tree/dev/michler-3d-contourf-offsets
-Andrew
···
On Wednesday 30 September 2009 19:22:42 Nicolas Bigaouette wrote:
Thanx all,
Can it be used to do a projection not only on the xoy axis but also on the xoz and yoz?
N
2009/10/9 Andrew Straw <strawman@…106…>
···
Matthias Michler wrote:
Hello list,
I’m not an expert in axes3d, but in case the feature which Nicolas requested
is not possible in an easy manner up to now, I propose an additional kwarg
for axes3d.Axes3D.contour. Something like offset. If offset is None the
z-values of the contour lines corresponds to given Z and otherwise offset is
used for the z-values of the contour lines.
I attached a changed axes3d.py and a patch against current svn. The result is
illustrated in the contour3d_demo.png.
Could any of the experts have a look at it and tell me if this could be
useful, please?
Thanks in advance for any comments.
Kind regards
Matthias
On Wednesday 30 September 2009 19:22:42 Nicolas Bigaouette wrote:
Hi,
I have a nice plot_surface() using mplot3d (see attachement).
I’d like to project the surface on the axis xoy, xoz and yoz with a
contour, similar to this figure:
http://homepages.ulb.ac.be/~dgonze/INFO/matlab/fig19.jpg
Is it possible using matplotlib and mplot3d?
Thanx!
Hi Matthias,
I committed your patch to a github branch of MPL, but I’ll let Reinier
actually commit something based on this to MPL.
http://github.com/astraw/matplotlib/tree/dev/michler-3d-contourf-offsets
-Andrew
Come build with us! The BlackBerry(R) Developer Conference in SF, CA
is the only developer event you need to attend this year. Jumpstart your
developing skills, take BlackBerry mobile applications to market and stay
ahead of the curve. Join us from November 9 - 12, 2009. Register now!
http://p.sf.net/sfu/devconference
Matplotlib-users mailing list
Matplotlib-users@lists.sourceforge.net
https://lists.sourceforge.net/lists/listinfo/matplotlib-users
Hi Andrew,
do you have any idea if the patch (or a part of it) may get a part of
matplotlib-svn some day?
Kind regards,
Matthias
···
On Friday 09 October 2009 23:25:28 Andrew Straw wrote:
Matthias Michler wrote:
> Hello list,
>
> I'm not an expert in axes3d, but in case the feature which Nicolas
> requested is not possible in an easy manner up to now, I propose an
> additional kwarg for axes3d.Axes3D.contour. Something like *offset*. If
> offset is None the z-values of the contour lines corresponds to given Z
> and otherwise offset is used for the z-values of the contour lines.
> I attached a changed axes3d.py and a patch against current svn. The
> result is illustrated in the contour3d_demo.png.
>
> Could any of the experts have a look at it and tell me if this could be
> useful, please?
>
> Thanks in advance for any comments.
>
> Kind regards
> Matthias
>
> On Wednesday 30 September 2009 19:22:42 Nicolas Bigaouette wrote:
>> Hi,
>> I have a nice plot_surface() using mplot3d (see attachement).
>>
>> I'd like to project the surface on the axis xoy, xoz and yoz with a
>> contour, similar to this figure:
>> http://homepages.ulb.ac.be/~dgonze/INFO/matlab/fig19.jpg
>>
>> Is it possible using matplotlib and mplot3d?
>>
>> Thanx!
Hi Matthias,
I committed your patch to a github branch of MPL, but I'll let Reinier
actually commit something based on this to MPL.
http://github.com/astraw/matplotlib/tree/dev/michler-3d-contourf-offsets
-Andrew
Hi Matthias,
I have a similar patch lying around somewhere, and I will try to apply
it soon. I've been terribly busy lately, but I expect some nice
mplot3d enhancements in the very near future.
Regards,
Reinier
···
On Wed, Dec 2, 2009 at 4:22 PM, Matthias Michler <MatthiasMichler@...361...> wrote:
Hi Andrew,
do you have any idea if the patch (or a part of it) may get a part of
matplotlib-svn some day?
Kind regards,
Matthias
On Friday 09 October 2009 23:25:28 Andrew Straw wrote:
Matthias Michler wrote:
> Hello list,
>
> I'm not an expert in axes3d, but in case the feature which Nicolas
> requested is not possible in an easy manner up to now, I propose an
> additional kwarg for axes3d.Axes3D.contour. Something like *offset*. If
> offset is None the z-values of the contour lines corresponds to given Z
> and otherwise offset is used for the z-values of the contour lines.
> I attached a changed axes3d.py and a patch against current svn. The
> result is illustrated in the contour3d_demo.png.
>
> Could any of the experts have a look at it and tell me if this could be
> useful, please?
>
> Thanks in advance for any comments.
>
> Kind regards
> Matthias
>
> On Wednesday 30 September 2009 19:22:42 Nicolas Bigaouette wrote:
>> Hi,
>> I have a nice plot_surface() using mplot3d (see attachement).
>>
>> I'd like to project the surface on the axis xoy, xoz and yoz with a
>> contour, similar to this figure:
>> http://homepages.ulb.ac.be/~dgonze/INFO/matlab/fig19.jpg
>>
>> Is it possible using matplotlib and mplot3d?
>>
>> Thanx!
Hi Matthias,
I committed your patch to a github branch of MPL, but I'll let Reinier
actually commit something based on this to MPL.
http://github.com/astraw/matplotlib/tree/dev/michler-3d-contourf-offsets
-Andrew
------------------------------------------------------------------------------
Join us December 9, 2009 for the Red Hat Virtual Experience,
a free event focused on virtualization and cloud computing.
Attend in-depth sessions from your desk. Your couch. Anywhere.
http://p.sf.net/sfu/redhat-sfdev2dev
_______________________________________________
Matplotlib-users mailing list
Matplotlib-users@lists.sourceforge.net
matplotlib-users List Signup and Options
--
Reinier Heeres
Tel: +31 6 10852639
Hi,
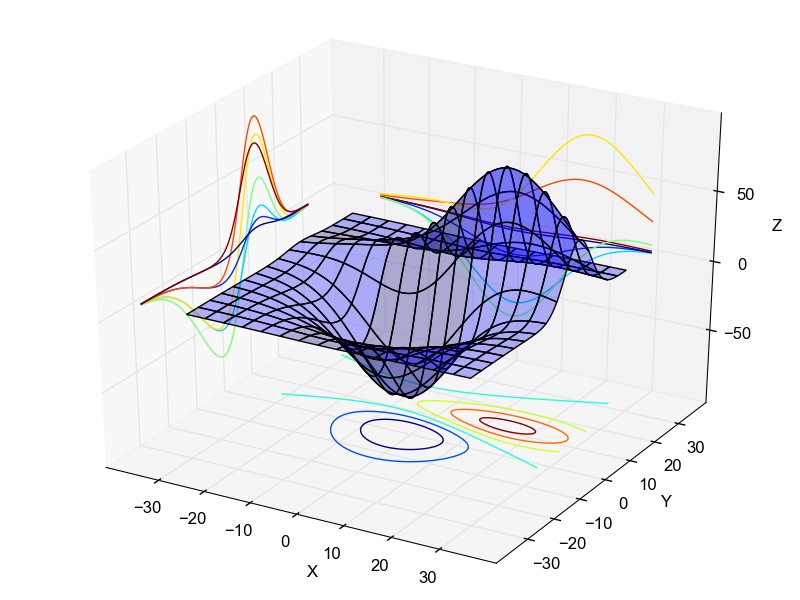
I just committed a patch to do this in svn, also allowing for contour
lines along other directions.
See the attached image for an example.
Cheers,
Reinier
···
On Thu, Dec 3, 2009 at 10:01 AM, Matthias Michler <MatthiasMichler@...361...> wrote:
Thanks a lot!
Regards,
Matthias
On Wednesday 02 December 2009 17:10:54 Reinier Heeres wrote:
Hi Matthias,
I have a similar patch lying around somewhere, and I will try to apply
it soon. I've been terribly busy lately, but I expect some nice
mplot3d enhancements in the very near future.
Regards,
Reinier
On Wed, Dec 2, 2009 at 4:22 PM, Matthias Michler >> >> <MatthiasMichler@...361...> wrote:
> Hi Andrew,
>
> do you have any idea if the patch (or a part of it) may get a part of
> matplotlib-svn some day?
>
> Kind regards,
> Matthias
>
> On Friday 09 October 2009 23:25:28 Andrew Straw wrote:
>> Matthias Michler wrote:
>> > Hello list,
>> >
>> > I'm not an expert in axes3d, but in case the feature which Nicolas
>> > requested is not possible in an easy manner up to now, I propose an
>> > additional kwarg for axes3d.Axes3D.contour. Something like *offset*.
>> > If offset is None the z-values of the contour lines corresponds to
>> > given Z and otherwise offset is used for the z-values of the contour
>> > lines. I attached a changed axes3d.py and a patch against current svn.
>> > The result is illustrated in the contour3d_demo.png.
>> >
>> > Could any of the experts have a look at it and tell me if this could
>> > be useful, please?
>> >
>> > Thanks in advance for any comments.
>> >
>> > Kind regards
>> > Matthias
>> >
>> > On Wednesday 30 September 2009 19:22:42 Nicolas Bigaouette wrote:
>> >> Hi,
>> >> I have a nice plot_surface() using mplot3d (see attachement).
>> >>
>> >> I'd like to project the surface on the axis xoy, xoz and yoz with a
>> >> contour, similar to this figure:
>> >> http://homepages.ulb.ac.be/~dgonze/INFO/matlab/fig19.jpg
>> >>
>> >> Is it possible using matplotlib and mplot3d?
>> >>
>> >> Thanx!
>>
>> Hi Matthias,
>>
>> I committed your patch to a github branch of MPL, but I'll let Reinier
>> actually commit something based on this to MPL.
>> http://github.com/astraw/matplotlib/tree/dev/michler-3d-contourf-offsets
>>
>> -Andrew
------------------------------------------------------------------------------
Join us December 9, 2009 for the Red Hat Virtual Experience,
a free event focused on virtualization and cloud computing.
Attend in-depth sessions from your desk. Your couch. Anywhere.
http://p.sf.net/sfu/redhat-sfdev2dev
_______________________________________________
Matplotlib-users mailing list
Matplotlib-users@lists.sourceforge.net
matplotlib-users List Signup and Options
--
Reinier Heeres
Tel: +31 6 10852639
Hi Reinier,
that looks great! Thanks a lot for all your effort!
Kind regards,
Matthias
···
On Friday 11 December 2009 00:36:59 Reinier Heeres wrote:
Hi,
I just committed a patch to do this in svn, also allowing for contour
lines along other directions.
See the attached image for an example.
Cheers,
Reinier
On Thu, Dec 3, 2009 at 10:01 AM, Matthias Michler > > <MatthiasMichler@...361...> wrote:
> Thanks a lot!
>
> Regards,
> Matthias
>
> On Wednesday 02 December 2009 17:10:54 Reinier Heeres wrote:
>> Hi Matthias,
>>
>> I have a similar patch lying around somewhere, and I will try to apply
>> it soon. I've been terribly busy lately, but I expect some nice
>> mplot3d enhancements in the very near future.
>>
>> Regards,
>> Reinier
>>
>> On Wed, Dec 2, 2009 at 4:22 PM, Matthias Michler > >> > >> <MatthiasMichler@...361...> wrote:
>> > Hi Andrew,
>> >
>> > do you have any idea if the patch (or a part of it) may get a part of
>> > matplotlib-svn some day?
>> >
>> > Kind regards,
>> > Matthias
>> >
>> > On Friday 09 October 2009 23:25:28 Andrew Straw wrote:
>> >> Matthias Michler wrote:
>> >> > Hello list,
>> >> >
>> >> > I'm not an expert in axes3d, but in case the feature which Nicolas
>> >> > requested is not possible in an easy manner up to now, I propose an
>> >> > additional kwarg for axes3d.Axes3D.contour. Something like
>> >> > *offset*. If offset is None the z-values of the contour lines
>> >> > corresponds to given Z and otherwise offset is used for the
>> >> > z-values of the contour lines. I attached a changed axes3d.py and a
>> >> > patch against current svn. The result is illustrated in the
>> >> > contour3d_demo.png.
>> >> >
>> >> > Could any of the experts have a look at it and tell me if this
>> >> > could be useful, please?
>> >> >
>> >> > Thanks in advance for any comments.
>> >> >
>> >> > Kind regards
>> >> > Matthias
>> >> >
>> >> > On Wednesday 30 September 2009 19:22:42 Nicolas Bigaouette wrote:
>> >> >> Hi,
>> >> >> I have a nice plot_surface() using mplot3d (see attachement).
>> >> >>
>> >> >> I'd like to project the surface on the axis xoy, xoz and yoz with
>> >> >> a contour, similar to this figure:
>> >> >> http://homepages.ulb.ac.be/~dgonze/INFO/matlab/fig19.jpg
>> >> >>
>> >> >> Is it possible using matplotlib and mplot3d?
>> >> >>
>> >> >> Thanx!
>> >>
>> >> Hi Matthias,
>> >>
>> >> I committed your patch to a github branch of MPL, but I'll let
>> >> Reinier actually commit something based on this to MPL.
>> >> http://github.com/astraw/matplotlib/tree/dev/michler-3d-contourf-offs
>> >>ets
>> >>
>> >> -Andrew
>
> -------------------------------------------------------------------------
>----- Join us December 9, 2009 for the Red Hat Virtual Experience,
> a free event focused on virtualization and cloud computing.
> Attend in-depth sessions from your desk. Your couch. Anywhere.
> http://p.sf.net/sfu/redhat-sfdev2dev
> _______________________________________________
> Matplotlib-users mailing list
> Matplotlib-users@lists.sourceforge.net
> matplotlib-users List Signup and Options
Reinier,
This in incredible. Wow. Thanks for all of your hard work.
Cheers,
-paul
···
-----Original Message-----
From: Reinier Heeres [mailto:reinier@…2663…]
Sent: Thursday, December 10, 2009 3:37 PM
To: Matthias Michler
Cc: matplotlib-users@lists.sourceforge.net
Subject: Re: [Matplotlib-users] mplot3d: plot_surface() and contour on
grid?
Hi,
I just committed a patch to do this in svn, also allowing for contour
lines along other directions.
See the attached image for an example.
Wonderful! Thanx a lot 
2009/12/11 <PHobson@…2850…>
···
Reinier,
This in incredible. Wow. Thanks for all of your hard work.
Cheers,
-paul
-----Original Message-----
From: Reinier Heeres [mailto:reinier@…2663…]
Sent: Thursday, December 10, 2009 3:37 PM
To: Matthias Michler
Cc: matplotlib-users@lists.sourceforge.net
Subject: Re: [Matplotlib-users] mplot3d: plot_surface() and contour on
grid?
Hi,
I just committed a patch to do this in svn, also allowing for contour
lines along other directions.
See the attached image for an example.
Return on Information:
Google Enterprise Search pays you back
Get the facts.
http://p.sf.net/sfu/google-dev2dev
Matplotlib-users mailing list
Matplotlib-users@lists.sourceforge.net
https://lists.sourceforge.net/lists/listinfo/matplotlib-users