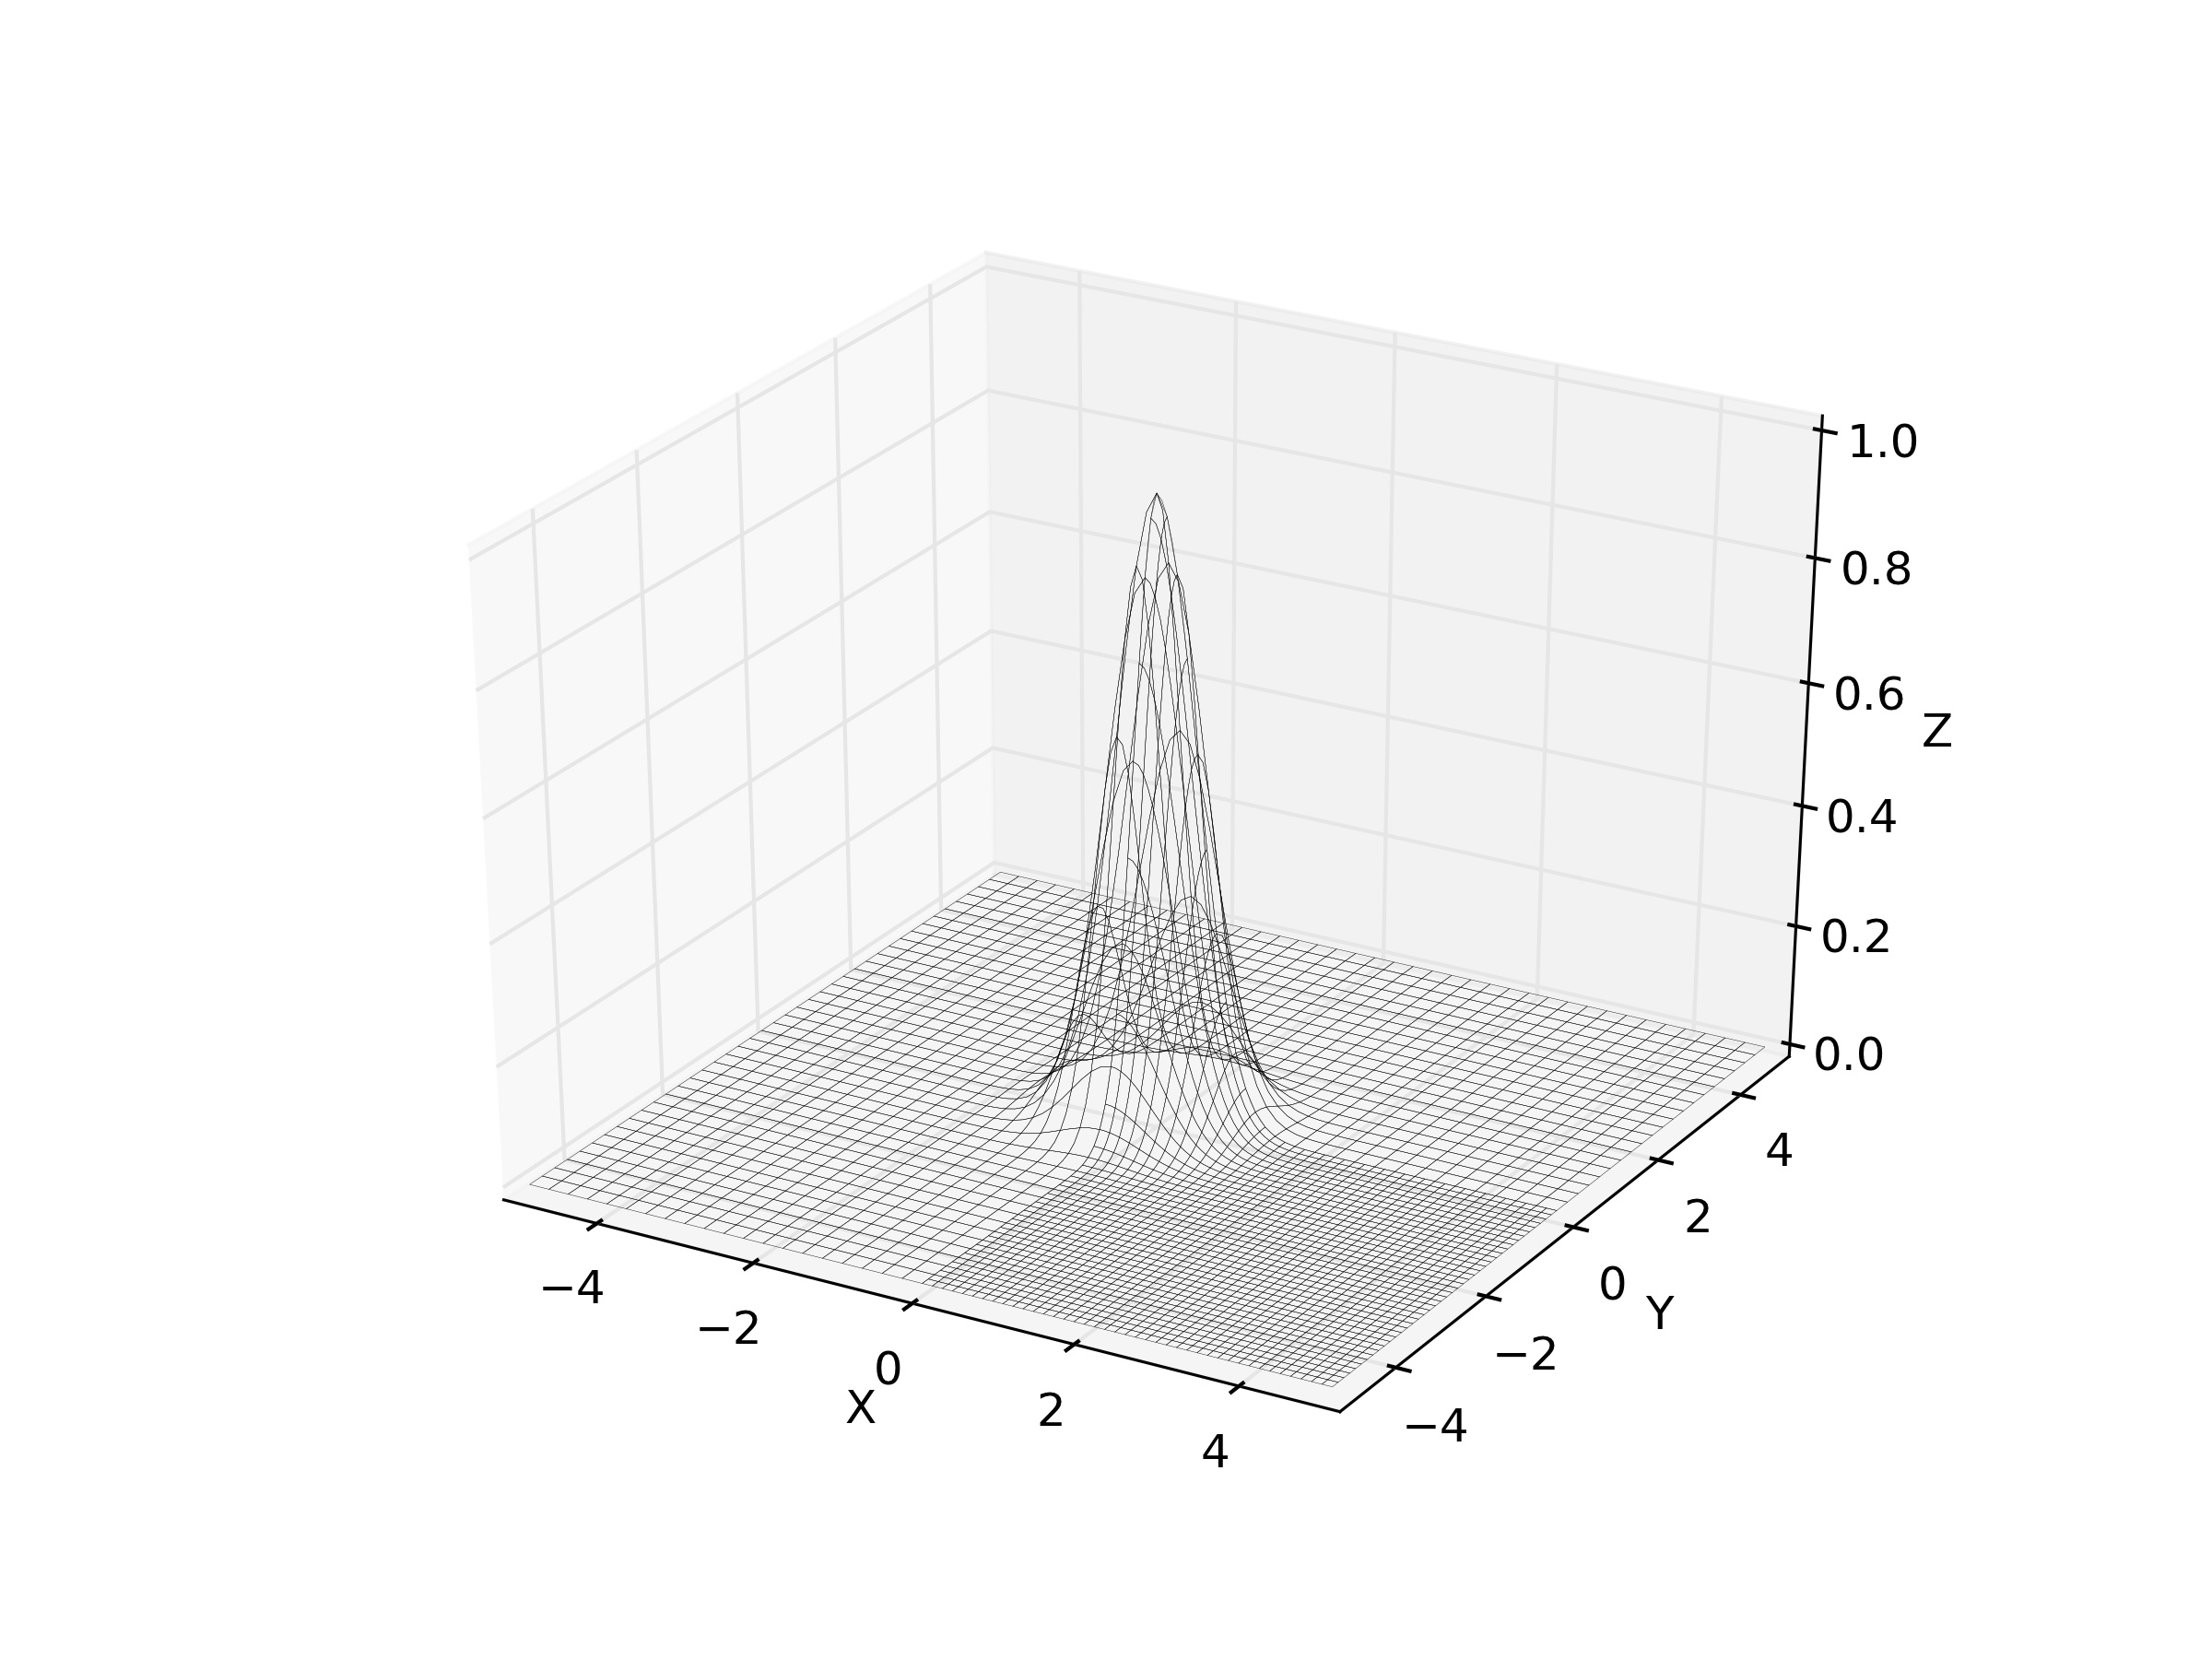
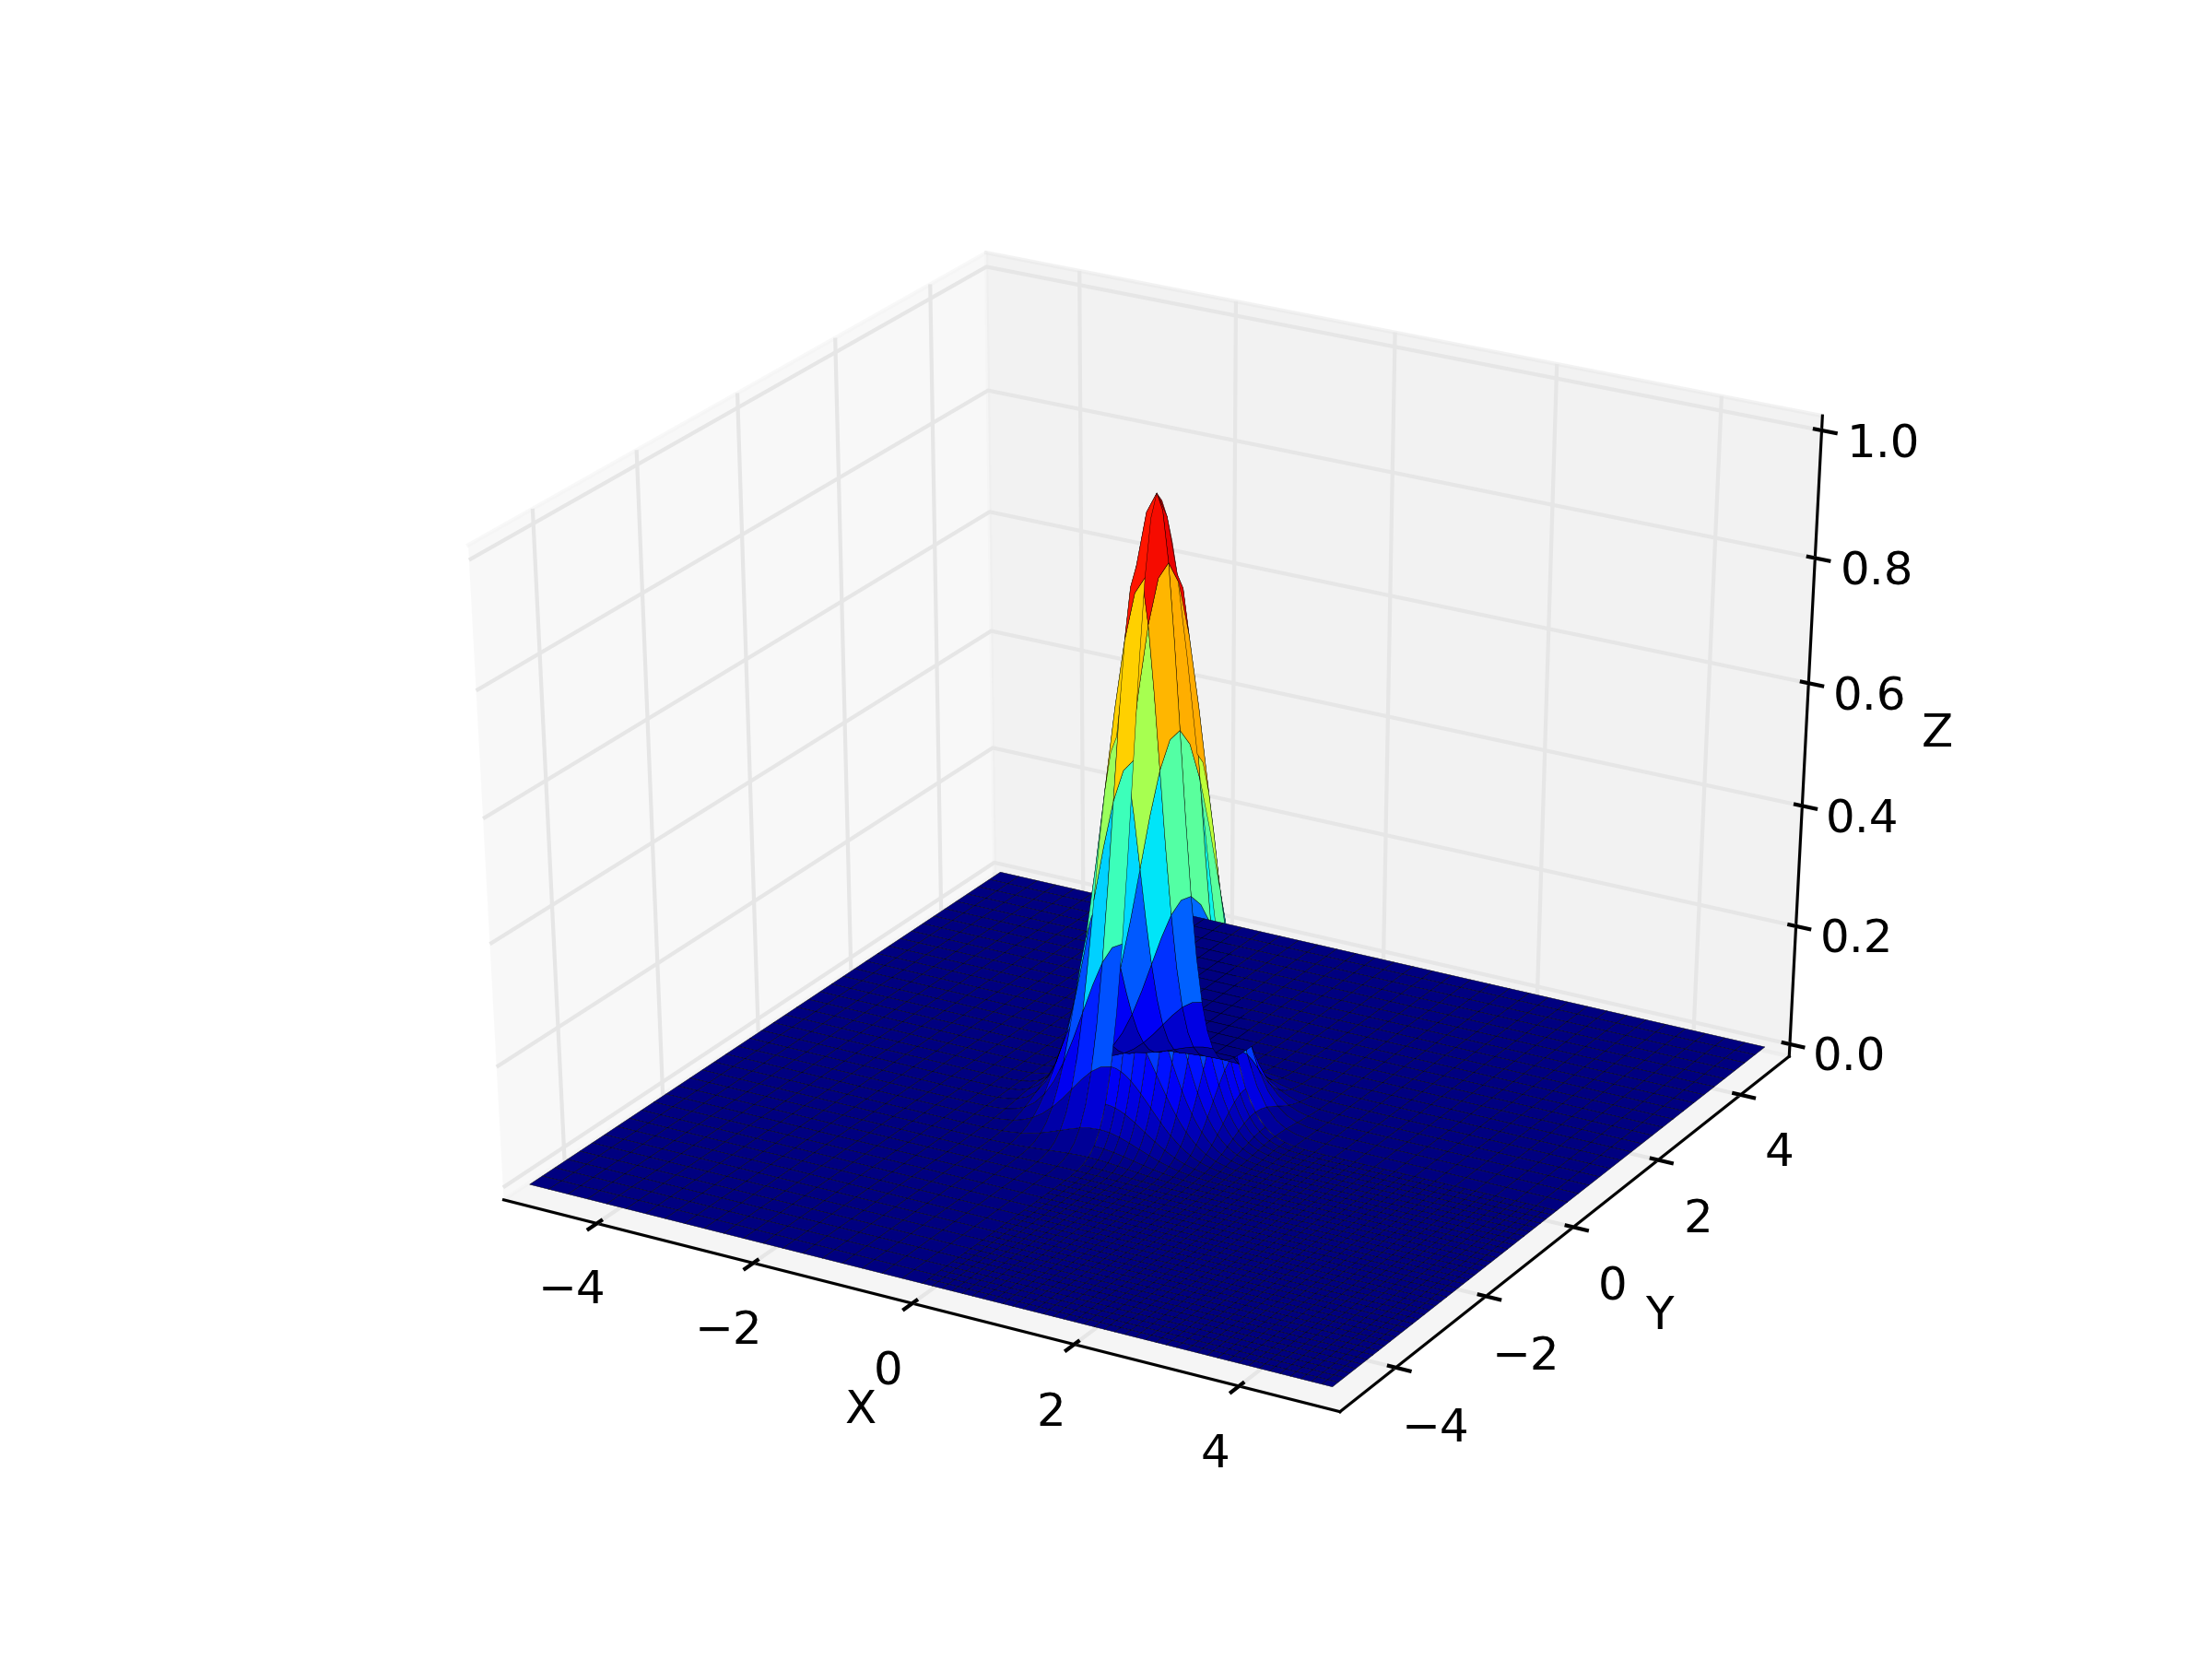
I am trying to make a 3D surfplot from multiple "patches". Basically, my function is split up into several blocks, and I to plot them one after the other into the same figure in order to get the full plot. I manage to get the data plotted, but it looks awful. It seems like the data is not layered correctly, with parts of the data that should be behind other things instead get in front of them. I attach example figures to illustrate my problem
1. 'image-bw.png'. No colors filled in (alpha = 0).
2. 'image-color.png'. With colors, alpha = 1.
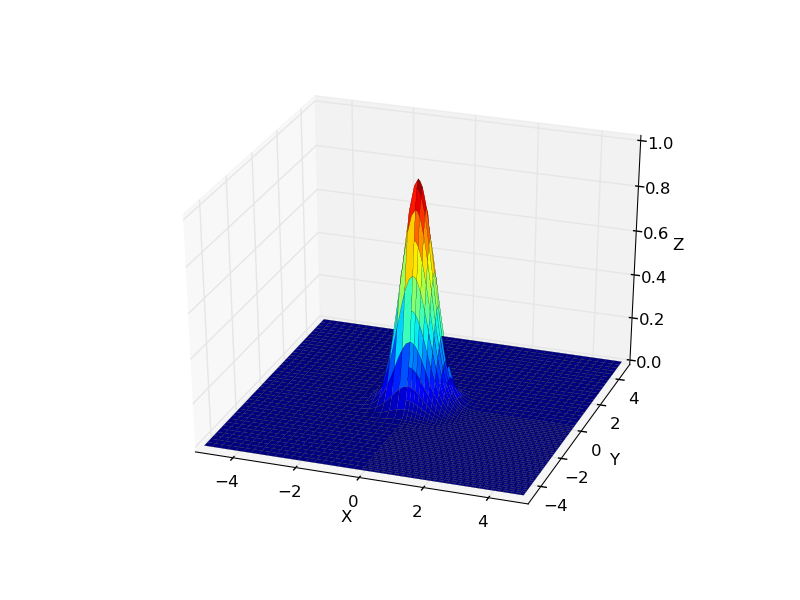
3. 'image-color-rot.png'. The same plot as 2, but slightly rotated.
Note how the problems dissappear in figure 3, where the plot has been rotated.
This is the function that does the plotting. It simply iterates over the blocks, and plots each block's data in the sub-domain that it represents.
def plotSurface(self):
fig = plt.figure()
ax = fig.gca(projection='3d')
minAbsVal = self.min()
maxAbsVal = self.max()
Z_norm = plt.Normalize(minAbsVal, maxAbsVal)
for node in self.nodes:
if node.type == 'leaf':
X = np.linspace(node.block.bounds[0,0], node.block.bounds[0,1], node.block.nx[0])
Y = np.linspace(node.block.bounds[1,0], node.block.bounds[1,1], node.block.nx[1])
X, Y = np.meshgrid(X, Y)
Z = abs(node.block.data)
pl = ax.plot_surface(X, Y, Z, rstride=2, cstride=2, cmap=mpl.cm.jet, norm=Z_norm, linewidth=0.1, alpha=1.0, shade=True, antialiased=True)
domain_bounds = self.nodes[0].block.bounds
ax.set_xlabel('X')
ax.set_xlim3d(domain_bounds[0,0], domain_bounds[0,1])
ax.set_ylabel('Y')
ax.set_ylim3d(domain_bounds[1,0], domain_bounds[1,1])
ax.set_zlabel('Z')
ax.set_zlim3d(minAbsVal,maxAbsVal)
Is this a bug or am I doing something wrong?
Best Regards,
Magnus Gustafsson