Hi,
Is there a way to change (and maybe remove) the background color (gray
by default) of axis in mplot3d graphics ?
Thanks,
Denis
Hi,
Is there a way to change (and maybe remove) the background color (gray
by default) of axis in mplot3d graphics ?
Thanks,
Denis
Denis,
There are probably other ways, but the one that I know off the top of my head is done at the savefig() function. If you want to remove the background entirely, you can specify the keyword argument transparent=True. You can change the color using the facecolor keyword argument. You can specify any color in that argument like you would elsewhere in matplotlib.
Ben Root
On Tue, Jun 1, 2010 at 4:42 PM, Denis Laxalde <dlaxalde@…287…> wrote:
Hi,
Is there a way to change (and maybe remove) the background color (gray
by default) of axis in mplot3d graphics ?
Thanks,
Denis
Matplotlib-users mailing list
Matplotlib-users@lists.sourceforge.net
https://lists.sourceforge.net/lists/listinfo/matplotlib-users
Hi Ben,
Thanks for your answer.
Actually, options for savefig seem to only operate on 2D axes whereas
I'm trying to change the color of 3D axes (x,y,z) which, by default,
have a grid with a gray background.
I manage to remove the grid lines but not the background color.
(My initial question was not very clear perhaps...)
Denis
Le mardi 01 juin 2010 à 16:57 -0500, Benjamin Root a écrit :
Denis,
There are probably other ways, but the one that I know off the top of my
head is done at the savefig() function. If you want to remove the
background entirely, you can specify the keyword argument transparent=True.
You can change the color using the facecolor keyword argument. You can
specify any color in that argument like you would elsewhere in matplotlib.Ben Root
On Tue, Jun 1, 2010 at 4:42 PM, Denis Laxalde <dlaxalde@...287...> wrote:
> Hi,
>
> Is there a way to change (and maybe remove) the background color (gray
> by default) of axis in mplot3d graphics ?
>
> Thanks,
>
> Denis
>
Sorry for the newbie question, how do you plot one x with multiple ys. In below data, x column is followed by 5 y columns:
Many thanks!
Howard
2 1.0000e+00 6.6232e-02 9.9392e-03 2.2992e-02 3.8111e-07
3 6.3664e-01 1.0269e-01 7.9107e-03 1.8254e-02 1.1391e-07
4 2.7590e-01 4.9783e-02 6.2644e-03 1.0943e-02 5.8480e-08
5 1.6550e-01 2.3269e-02 4.7482e-03 8.4312e-03 5.8239e-08
6 1.1590e-01 1.7234e-02 3.8567e-03 8.7010e-03 4.5506e-08
7 7.4337e-02 1.1662e-02 3.3756e-03 8.0889e-03 4.0900e-08
8 5.7775e-02 1.0917e-02 2.8980e-03 6.9654e-03 3.7520e-08
9 4.7310e-02 1.1869e-02 2.5929e-03 5.8326e-03 3.4745e-08
10 3.9591e-02 1.1301e-02 2.4691e-03 5.2749e-03 3.2126e-08
11 3.6517e-02 1.0755e-02 2.3121e-03 4.8631e-03 3.7942e-08
12 3.2872e-02 9.8306e-03 2.1692e-03 4.6281e-03 3.2358e-08
13 3.1235e-02 9.1704e-03 2.0419e-03 4.3928e-03 3.1479e-08
14 2.9528e-02 8.6926e-03 1.9364e-03 4.1360e-03 3.5639e-08
15 2.7895e-02 8.3080e-03 1.8475e-03 3.9015e-03 3.0486e-08
16 2.6440e-02 7.9610e-03 1.7776e-03 3.6790e-03 3.0307e-08
17 2.5259e-02 7.6345e-03 1.6984e-03 3.4743e-03 3.1805e-08
18 2.4064e-02 7.3267e-03 1.6341e-03 3.2848e-03 3.0188e-08
19 2.3171e-02 7.0284e-03 1.5821e-03 3.1098e-03 2.7565e-08
20 2.2317e-02 6.7322e-03 1.5247e-03 2.9475e-03 2.7009e-08
-----------------------------------------------------------------------------------
This email message is for the sole use of the intended recipient(s) and may contain
confidential information. Any unauthorized review, use, disclosure or distribution
is prohibited. If you are not the intended recipient, please contact the sender by
reply email and destroy all copies of the original message.
-----------------------------------------------------------------------------------
Matplotlib has excellent documentation:
http://matplotlib.sourceforge.net/api/pyplot_api.html#matplotlib.pyplot.plot
hth,
Alan Isaac
On 6/1/2010 7:05 PM, Howard Sun wrote:
Sorry for the newbie question, how do you plot one x with multiple ys. In below data, x column is followed by 5 y columns
You can make an x vector and a y array, so that the first dimension of y is the same length as x:
import numpy as np
import matplotlib.pyplot as plt
x = np.arange(2,21)
y = np.random.random(size=(19,5)) + np.arange(5)[None,:]
plt.plot(x,y)
Angus.
On 1 June 2010 19:05, Howard Sun <hsun@…3134…> wrote:
Sorry for the newbie question, how do you plot one x with multiple ys. In below data, x column is followed by 5 y columns:
Many thanks!
–
AJC McMorland
Post-doctoral research fellow
Neurobiology, University of Pittsburgh
Howard Sun <hsun@...3134...>
Sorry for the newbie question, how do you plot one x with multiple ys. In
below data, x column is followed by 5 y columns: Many thanks!
Howard2 1.0000e+00 6.6232e-02 9.9392e-03 2.2992e-02 3.8111e-07
3 6.3664e-01 1.0269e-01 7.9107e-03 1.8254e-02 1.1391e-07
4 2.7590e-01 4.9783e-02 6.2644e-03 1.0943e-02 5.8480e-08
5 1.6550e-01 2.3269e-02 4.7482e-03 8.4312e-03 5.8239e-08
6 1.1590e-01 1.7234e-02 3.8567e-03 8.7010e-03 4.5506e-08
7 7.4337e-02 1.1662e-02 3.3756e-03 8.0889e-03 4.0900e-08
8 5.7775e-02 1.0917e-02 2.8980e-03 6.9654e-03 3.7520e-08
9 4.7310e-02 1.1869e-02 2.5929e-03 5.8326e-03 3.4745e-08
10 3.9591e-02 1.1301e-02 2.4691e-03 5.2749e-03 3.2126e-08
11 3.6517e-02 1.0755e-02 2.3121e-03 4.8631e-03 3.7942e-08
12 3.2872e-02 9.8306e-03 2.1692e-03 4.6281e-03 3.2358e-08
13 3.1235e-02 9.1704e-03 2.0419e-03 4.3928e-03 3.1479e-08
14 2.9528e-02 8.6926e-03 1.9364e-03 4.1360e-03 3.5639e-08
15 2.7895e-02 8.3080e-03 1.8475e-03 3.9015e-03 3.0486e-08
16 2.6440e-02 7.9610e-03 1.7776e-03 3.6790e-03 3.0307e-08
17 2.5259e-02 7.6345e-03 1.6984e-03 3.4743e-03 3.1805e-08
18 2.4064e-02 7.3267e-03 1.6341e-03 3.2848e-03 3.0188e-08
19 2.3171e-02 7.0284e-03 1.5821e-03 3.1098e-03 2.7565e-08
20 2.2317e-02 6.7322e-03 1.5247e-03 2.9475e-03 2.7009e-08
First, you take the data apart, like in:
import csv, numpy
# let's call your array "filecopy"
d = csv.Sniffer().sniff(filecopy[0])
for this_one_line in csv.reader(filecopy, d):
    header = this_one_line

    break
data = numpy.zeros((len(header), len(filecopy)))
for line in csv.reader(filecopy[1:], d):
    for n in range(len(header)):

        data[n][linecounter] = float(line[n])

    linecounter += 1
And then, you plot it:
from matplotlib import pyplot
fig = pyplot.figure()
s = fig.add_subplot(1, 1, 1)
for c in data:
s.plot(data[0], c)
pyplot.show()
Obviously, that's all taken from another script and won't work "as is" and
there might be functions which would make some of this easier.
The main reason for posting this is being that bad that someone couldn't take
the pain and post something better - and me learning in the process.
Sincerely,
Malte
Howard,
Are you trying to plot 4 lines with the same y-axis or with two or more y-axes? I only ask because the values of your 5th column are many orders of magnitude smaller than the values of the other ys.
If you want multiple y-axes on the same plot, then you might want to look at Parasite Axes. If not, then you can very simply plot this like so (assuming that ‘data’ is a 2-D numpy array).
import matplotlib.pyplot as plt
plt.plot(data[:, 0], data[:, 1])
plt.plot(data[:, 0], data[:, 2])
plt.plot(data[:, 0], data[:, 3])
plt.plot(data[:, 0], data[:, 4])
plt.show()
I am sure that my 4 plot statements can be simplified, but I can’t verify that right now.
I hope that helps.
Ben Root
On Tue, Jun 1, 2010 at 6:05 PM, Howard Sun <hsun@…3134…> wrote:
Sorry for the newbie question, how do you plot one x with multiple ys. In below data, x column is followed by 5 y columns:
Many thanks!
Howard
2 1.0000e+00 6.6232e-02 9.9392e-03 2.2992e-02 3.8111e-07
3 6.3664e-01 1.0269e-01 7.9107e-03 1.8254e-02 1.1391e-07
4 2.7590e-01 4.9783e-02 6.2644e-03 1.0943e-02 5.8480e-08
5 1.6550e-01 2.3269e-02 4.7482e-03 8.4312e-03 5.8239e-08
6 1.1590e-01 1.7234e-02 3.8567e-03 8.7010e-03 4.5506e-08
7 7.4337e-02 1.1662e-02 3.3756e-03 8.0889e-03 4.0900e-08
8 5.7775e-02 1.0917e-02 2.8980e-03 6.9654e-03 3.7520e-08
9 4.7310e-02 1.1869e-02 2.5929e-03 5.8326e-03 3.4745e-08
10 3.9591e-02 1.1301e-02 2.4691e-03 5.2749e-03 3.2126e-08
11 3.6517e-02 1.0755e-02 2.3121e-03 4.8631e-03 3.7942e-08
12 3.2872e-02 9.8306e-03 2.1692e-03 4.6281e-03 3.2358e-08
13 3.1235e-02 9.1704e-03 2.0419e-03 4.3928e-03 3.1479e-08
14 2.9528e-02 8.6926e-03 1.9364e-03 4.1360e-03 3.5639e-08
15 2.7895e-02 8.3080e-03 1.8475e-03 3.9015e-03 3.0486e-08
16 2.6440e-02 7.9610e-03 1.7776e-03 3.6790e-03 3.0307e-08
17 2.5259e-02 7.6345e-03 1.6984e-03 3.4743e-03 3.1805e-08
18 2.4064e-02 7.3267e-03 1.6341e-03 3.2848e-03 3.0188e-08
19 2.3171e-02 7.0284e-03 1.5821e-03 3.1098e-03 2.7565e-08
20 2.2317e-02 6.7322e-03 1.5247e-03 2.9475e-03 2.7009e-08
This email message is for the sole use of the intended recipient(s) and may contain
confidential information. Any unauthorized review, use, disclosure or distribution
is prohibited. If you are not the intended recipient, please contact the sender by
reply email and destroy all copies of the original message.
Matplotlib-users mailing list
Matplotlib-users@lists.sourceforge.net
https://lists.sourceforge.net/lists/listinfo/matplotlib-users
Howard,
Are you trying to plot 4 lines with the same y-axis or with two or more
y-axes? I only ask because the values of your 5th column are many
orders of magnitude smaller than the values of the other ys.If you want multiple y-axes on the same plot, then you might want to
look at Parasite Axes. If not, then you can very simply plot this like
so (assuming that 'data' is a 2-D numpy array).import matplotlib.pyplot as plt
plt.plot(data[:, 0], data[:, 1])
plt.plot(data[:, 0], data[:, 2])
plt.plot(data[:, 0], data[:, 3])
plt.plot(data[:, 0], data[:, 4])plt.show()
I am sure that my 4 plot statements can be simplified, but I can't
verify that right now.
import numpy as np
import matplotlib.pyplot as plt
x = np.arange(2, 5, 0.3)
y = np.random.randn(len(x), 4) # dummy data for illustration
plt.plot(x, y)
So with the data array as above, it would be
plt.plot(data[:,0], data[:, 1:])
Eric
On 06/01/2010 02:47 PM, Benjamin Root wrote:
I hope that helps.
Ben Root
Malte,
You may want to look into Numpy’s genfromtxt() or loadtxt() functions. They will make your life so much easier for loading data from a text file.
Ben Root
On Tue, Jun 1, 2010 at 6:47 PM, Malte Dik <malte.dik@…273…> wrote:
Howard Sun <hsun@…3134…>
Sorry for the newbie question, how do you plot one x with multiple ys. In
below data, x column is followed by 5 y columns: Many thanks!
Howard
2 1.0000e+00 6.6232e-02 9.9392e-03 2.2992e-02 3.8111e-07
3 6.3664e-01 1.0269e-01 7.9107e-03 1.8254e-02 1.1391e-07
4 2.7590e-01 4.9783e-02 6.2644e-03 1.0943e-02 5.8480e-08
5 1.6550e-01 2.3269e-02 4.7482e-03 8.4312e-03 5.8239e-08
6 1.1590e-01 1.7234e-02 3.8567e-03 8.7010e-03 4.5506e-08
7 7.4337e-02 1.1662e-02 3.3756e-03 8.0889e-03 4.0900e-08
8 5.7775e-02 1.0917e-02 2.8980e-03 6.9654e-03 3.7520e-08
9 4.7310e-02 1.1869e-02 2.5929e-03 5.8326e-03 3.4745e-08
10 3.9591e-02 1.1301e-02 2.4691e-03 5.2749e-03 3.2126e-08
11 3.6517e-02 1.0755e-02 2.3121e-03 4.8631e-03 3.7942e-08
12 3.2872e-02 9.8306e-03 2.1692e-03 4.6281e-03 3.2358e-08
13 3.1235e-02 9.1704e-03 2.0419e-03 4.3928e-03 3.1479e-08
14 2.9528e-02 8.6926e-03 1.9364e-03 4.1360e-03 3.5639e-08
15 2.7895e-02 8.3080e-03 1.8475e-03 3.9015e-03 3.0486e-08
16 2.6440e-02 7.9610e-03 1.7776e-03 3.6790e-03 3.0307e-08
17 2.5259e-02 7.6345e-03 1.6984e-03 3.4743e-03 3.1805e-08
18 2.4064e-02 7.3267e-03 1.6341e-03 3.2848e-03 3.0188e-08
19 2.3171e-02 7.0284e-03 1.5821e-03 3.1098e-03 2.7565e-08
20 2.2317e-02 6.7322e-03 1.5247e-03 2.9475e-03 2.7009e-08
First, you take the data apart, like in:
import csv, numpy
let’s call your array “filecopy”
d = csv.Sniffer().sniff(filecopy[0])
for this_one_line in csv.reader(filecopy, d):
header = this_one_line breakdata = numpy.zeros((len(header), len(filecopy)))
for line in csv.reader(filecopy[1:], d):
for n in range(len(header)): data[n][linecounter] = float(line[n]) linecounter += 1
Huh, how about that? I never noticed that before. I wonder if that is a bug or if it is intentional?
Ben Root
On Tue, Jun 1, 2010 at 5:28 PM, Denis Laxalde <dlaxalde@…287…> wrote:
Hi Ben,
Thanks for your answer.
Actually, options for savefig seem to only operate on 2D axes whereas
I’m trying to change the color of 3D axes (x,y,z) which, by default,
have a grid with a gray background.
I manage to remove the grid lines but not the background color.
(My initial question was not very clear perhaps…)
DenisLe mardi 01 juin 2010 à 16:57 -0500, Benjamin Root a écrit :
Denis,
There are probably other ways, but the one that I know off the top of my
head is done at the savefig() function. If you want to remove the
background entirely, you can specify the keyword argument transparent=True.
You can change the color using the facecolor keyword argument. You can
specify any color in that argument like you would elsewhere in matplotlib.
Ben Root
On Tue, Jun 1, 2010 at 4:42 PM, Denis Laxalde <dlaxalde@…287…> wrote:
Hi,
Is there a way to change (and maybe remove) the background color (gray
by default) of axis in mplot3d graphics ?
Thanks,
Denis
Thanks alot, Alan, Angus, Ben, Eric and Malte, for the tips and the varieties. Matplotlib is awesome!
Howard Sun, Ph.D.
NVIDIA CORP.
2701 San Tomas Expressway
Santa Clara, CA 95050
T (408) 566-5036
F (408) 486-8207
-----Original Message-----
From: Eric Firing [mailto:efiring@…202…]
Sent: Tuesday, June 01, 2010 7:07 PM
To: matplotlib-users@lists.sourceforge.net
Subject: Re: [Matplotlib-users] multiple lines
On 06/01/2010 02:47 PM, Benjamin Root wrote:
Howard,
Are you trying to plot 4 lines with the same y-axis or with two or more
y-axes? I only ask because the values of your 5th column are many
orders of magnitude smaller than the values of the other ys.If you want multiple y-axes on the same plot, then you might want to
look at Parasite Axes. If not, then you can very simply plot this like
so (assuming that 'data' is a 2-D numpy array).import matplotlib.pyplot as plt
plt.plot(data[:, 0], data[:, 1])
plt.plot(data[:, 0], data[:, 2])
plt.plot(data[:, 0], data[:, 3])
plt.plot(data[:, 0], data[:, 4])plt.show()
I am sure that my 4 plot statements can be simplified, but I can't
verify that right now.
import numpy as np
import matplotlib.pyplot as plt
x = np.arange(2, 5, 0.3)
y = np.random.randn(len(x), 4) # dummy data for illustration
plt.plot(x, y)
So with the data array as above, it would be
plt.plot(data[:,0], data[:, 1:])
Eric
I hope that helps.
Ben Root
------------------------------------------------------------------------------
_______________________________________________
Matplotlib-users mailing list
Matplotlib-users@lists.sourceforge.net
-----------------------------------------------------------------------------------
This email message is for the sole use of the intended recipient(s) and may contain
confidential information. Any unauthorized review, use, disclosure or distribution
is prohibited. If you are not the intended recipient, please contact the sender by
reply email and destroy all copies of the original message.
-----------------------------------------------------------------------------------
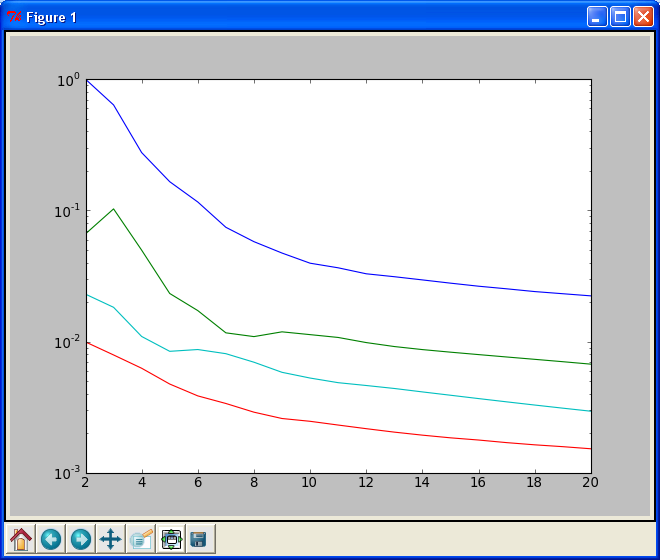
Thanks all for the help again, after a bit trial-n-error, this
is what I did, (only 4 lines of code):
x5y = np.loadtxt(fp)
x,y = x5y[:, 0], x5y[:, 1:5]
#plt.plot(x, y)
plt.semilogy(x, y)
plt.show()
and the plot. Btw, I am not a SW guy as you probably can tell,
but a CFD (computational Fluid Dynamics) guy who happens to write code. The plot
is a convergence history plot of an iterative algorithm.
From: Benjamin Root
[mailto:ben.root@…1304…]
Sent: Tuesday, June 01, 2010 7:24 PM
To: Malte Dik
Cc: matplotlib-users@lists.sourceforge.net
Subject: Re: [Matplotlib-users] multiple lines
Malte,
You may want to look into Numpy’s genfromtxt() or loadtxt() functions.
They will make your life so much easier for loading data from a text file.
Ben Root
On Tue, Jun 1, 2010 at 6:47 PM, Malte Dik <malte.dik@…273…> wrote:
Howard Sun <hsun@…3134…>
Sorry for the newbie
question, how do you plot one x with multiple ys. In
below data, x column is followed by 5 y columns: Many thanks!
Howard2 1.0000e+00 6.6232e-02 9.9392e-03 2.2992e-02 3.8111e-07
3 6.3664e-01 1.0269e-01 7.9107e-03 1.8254e-02 1.1391e-07
4 2.7590e-01 4.9783e-02 6.2644e-03 1.0943e-02 5.8480e-08
5 1.6550e-01 2.3269e-02 4.7482e-03 8.4312e-03 5.8239e-08
6 1.1590e-01 1.7234e-02 3.8567e-03 8.7010e-03 4.5506e-08
7 7.4337e-02 1.1662e-02 3.3756e-03 8.0889e-03 4.0900e-08
8 5.7775e-02 1.0917e-02 2.8980e-03 6.9654e-03 3.7520e-08
9 4.7310e-02 1.1869e-02 2.5929e-03 5.8326e-03 3.4745e-08
10 3.9591e-02 1.1301e-02 2.4691e-03 5.2749e-03 3.2126e-08
11 3.6517e-02 1.0755e-02 2.3121e-03 4.8631e-03 3.7942e-08
12 3.2872e-02 9.8306e-03 2.1692e-03 4.6281e-03 3.2358e-08
13 3.1235e-02 9.1704e-03 2.0419e-03 4.3928e-03 3.1479e-08
14 2.9528e-02 8.6926e-03 1.9364e-03 4.1360e-03 3.5639e-08
15 2.7895e-02 8.3080e-03 1.8475e-03 3.9015e-03 3.0486e-08
16 2.6440e-02 7.9610e-03 1.7776e-03 3.6790e-03 3.0307e-08
17 2.5259e-02 7.6345e-03 1.6984e-03 3.4743e-03 3.1805e-08
18 2.4064e-02 7.3267e-03 1.6341e-03 3.2848e-03 3.0188e-08
19 2.3171e-02 7.0284e-03 1.5821e-03 3.1098e-03 2.7565e-08
20 2.2317e-02 6.7322e-03 1.5247e-03 2.9475e-03 2.7009e-08
First, you take the data apart,
like in:
import csv, numpy
d = csv.Sniffer().sniff(filecopy[0])
for this_one_line in csv.reader(filecopy, d):
header = this_one_line
break
data = numpy.zeros((len(header), len(filecopy)))
for line in csv.reader(filecopy[1:], d):
for n in range(len(header)):
data[n][linecounter] = float(line[n])
linecounter += 1
This email message is for the sole use of the intended recipient(s) and may contain confidential information. Any unauthorized review, use, disclosure or distribution is prohibited. If you are not the intended recipient, please contact the sender by reply email and destroy all copies of the original message.