Hi,
I've been playing around with mplotlib's 3d charting functionality.
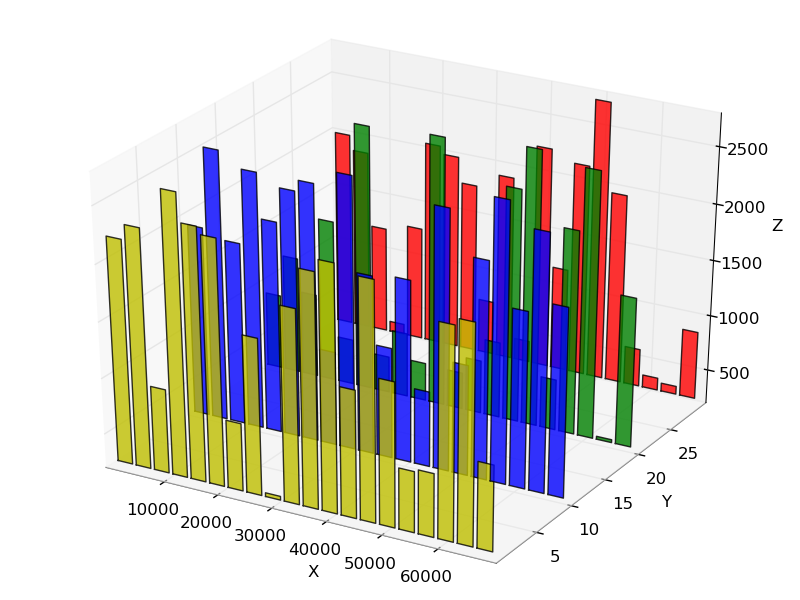
I wanted to generate something similar to this example:
http://matplotlib.sourceforge.net/plot_directive/mpl_examples/mplot3d/bars3d_demo.py
However, the number on scales are off (see attached). It should look like this:
http://matplotlib.sourceforge.net/_images/bars3d_demo.png
I'm running matplotlib-0.99.0. Is this a known issue?
Thanks,
Sammy
I have reported that issue on the tracker at the end of July. You can fin dit here:
http://sourceforge.net/tracker/?func=detail&atid=560720&aid=2830483&group_id=80706
It’s supposed to be fixed in 0.99… are you sure you are using it?
I remember trying it just after the bug was closed with an svn version and it was working. But then again I just tried it (0.99.0) and I get the bad behaviour… You seem not to be the only one! Maybe the issue should be re-opened.
2009/9/16 Sammy Yu <temijun@…287…>
···
Hi,
I’ve been playing around with mplotlib’s 3d charting functionality.
I wanted to generate something similar to this example:
http://matplotlib.sourceforge.net/plot_directive/mpl_examples/mplot3d/bars3d_demo.py
However, the number on scales are off (see attached). It should look like this:
http://matplotlib.sourceforge.net/_images/bars3d_demo.png
I’m running matplotlib-0.99.0. Is this a known issue?
Thanks,
Sammy
Come build with us! The BlackBerry® Developer Conference in SF, CA
is the only developer event you need to attend this year. Jumpstart your
developing skills, take BlackBerry mobile applications to market and stay
ahead of the curve. Join us from November 9-12, 2009. Register now!
http://p.sf.net/sfu/devconf
Matplotlib-users mailing list
Matplotlib-users@lists.sourceforge.net
https://lists.sourceforge.net/lists/listinfo/matplotlib-users
The bug was fixed on the 0.99.x branch, not in 0.99.0 (which predates the fix). The fix should, however, make it into the forthcoming 0.99.1 release.
Cheers,
Mike
Nicolas Bigaouette wrote:
···
I have reported that issue on the tracker at the end of July. You can fin dit here:
http://sourceforge.net/tracker/?func=detail&atid=560720&aid=2830483&group_id=80706
It's supposed to be fixed in 0.99... are you sure you are using it?
I remember trying it just after the bug was closed with an svn version and it was working. But then again I just tried it (0.99.0) and I get the bad behaviour... You seem not to be the only one! Maybe the issue should be re-opened.
2009/9/16 Sammy Yu <temijun@...287... <mailto:temijun@…287…>>
Hi,
I've been playing around with mplotlib's 3d charting functionality.
I wanted to generate something similar to this example:
http://matplotlib.sourceforge.net/plot_directive/mpl_examples/mplot3d/bars3d_demo.py
However, the number on scales are off (see attached). It should
look like this:
http://matplotlib.sourceforge.net/_images/bars3d_demo.png
I'm running matplotlib-0.99.0. Is this a known issue?
Thanks,
Sammy
------------------------------------------------------------------------------
Come build with us! The BlackBerry® Developer Conference in SF, CA
is the only developer event you need to attend this year.
Jumpstart your
developing skills, take BlackBerry mobile applications to market
and stay
ahead of the curve. Join us from November 9-12, 2009. Register
now!
http://p.sf.net/sfu/devconf
_______________________________________________
Matplotlib-users mailing list
Matplotlib-users@lists.sourceforge.net
<mailto:Matplotlib-users@lists.sourceforge.net>
matplotlib-users List Signup and Options
------------------------------------------------------------------------
------------------------------------------------------------------------------
Come build with us! The BlackBerry® Developer Conference in SF, CA
is the only developer event you need to attend this year. Jumpstart your
developing skills, take BlackBerry mobile applications to market and stay ahead of the curve. Join us from November 9-12, 2009. Register now!
http://p.sf.net/sfu/devconf
------------------------------------------------------------------------
_______________________________________________
Matplotlib-users mailing list
Matplotlib-users@lists.sourceforge.net
matplotlib-users List Signup and Options
--
Michael Droettboom
Science Software Branch
Operations and Engineering Division
Space Telescope Science Institute
Operated by AURA for NASA