matshow?

A pox on matplotlib's default reply-to-sender!
Resending my reply that went to Fernando alone below.

> > Why does pylab.matshow() create a new figure by default when no other
> > standard pylab function I know of does that? It seems very
> > inconsistent for no particular gain, since as always
> > figure();matshow(m) will achieve that result if that is what is
> > desired.
>
> No: matshow has to create a figure with a non-standard size so that
> the final figure has the same aspect ratio as the array being
> displayed. If you call figure() first, the figure has already been
> created.
>
> The code:
>
> # Extract actual aspect ratio of array and make appropriately sized figure
> w,h = figaspect(arr)
> fig = figure(fignum,figsize=(w,h))

I guess that makes sense.
Personally I'd rather have consistency. I'm not sure why matshow() in
particular needs to have the window shape match the image shape.

Why not just do axis('scaled') within the confines of the window you have?
Tried it out, it seems to work pretty well, and seems more consistent
with the way other things work in pylab.

def mymatshow(*args,**kw):
   """Display an array as a matrix in a new figure window.
   The origin is set at the upper left hand corner and rows (first dimension
   of the array) are displayed horizontally. The aspect ratio of the figure
   window is that of the array, as long as it is possible to fit it within
   your screen with no stretching. If the window dimensions can't accomodate
   this (extremely tall/wide arrays), some stretching will inevitably occur.
   Tick labels for the xaxis are placed on top by default.
   matshow() calls imshow() with args and **kwargs, but by default it sets
   interpolation='nearest' (unless you override it). All other arguments and
   keywords are passed to imshow(), so see its docstring for further details.
   Special keyword arguments which are NOT passed to imshow():
     - fignum(None): by default, matshow() creates a new figure window with
     automatic numbering. If fignum is given as an integer, the created
     figure will use this figure number. Because of how matshow() tries to
     set the figure aspect ratio to be the one of the array, if you provide
     the number of an already existing figure, strange things may happen.
     - returnall(False): by default, the return value is a figure instance.
     With 'returnall=True', a (figure, axes, image) tuple is returned.
   Example usage:
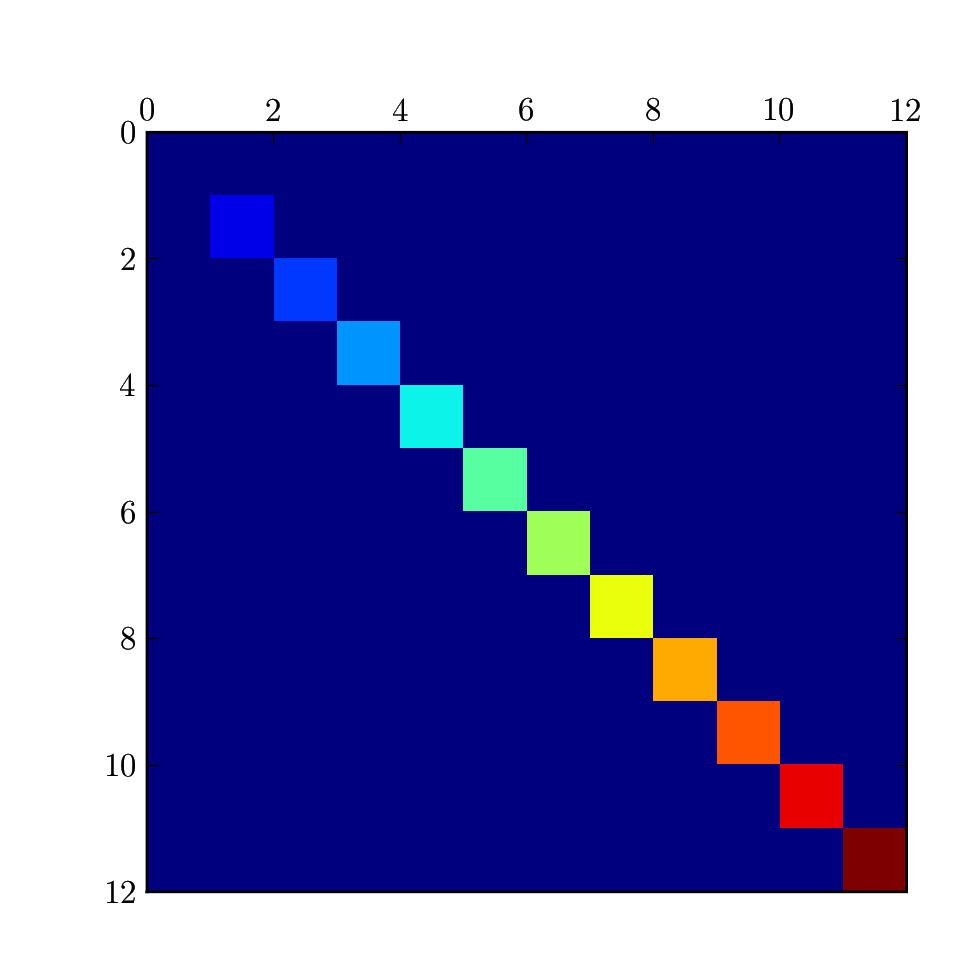
   def samplemat(dims):
       aa = zeros(dims)
       for i in range(min(dims)):
           aa[i,i] = i
       return aa
   dimlist = [(12,12),(128,64),(64,512),(2048,256)]
   for d in dimlist:
       fig, ax, im = matshow(samplemat(d))
   show()
   """
   # Preprocess args for our purposes
   arr = asarray(args[0])

   # Extract unique keywords we can't pass to imshow
   kw = kw.copy()
   fignum = popd(kw,'fignum',None)
   retall = popd(kw,'returnall',False)

   # Extract actual aspect ratio of array and make appropriately sized figure
   w,h = figaspect(arr)
   #fig = figure(fignum,figsize=(w,h))
   fig = gcf()
   cla()
   ax = fig.add_axes([0.15, 0.09, 0.775, 0.775])
   axis('scaled')

   ax.xaxis.tick_top()
   ax.title.set_y(1.05) # raise it up a bit for tick top
   kw['aspect'] = 'auto'
   # imshow call: use 'lower' origin (we'll flip axes later)
   kw['origin'] = 'lower'
   # Unless overridden, don't interpolate
   kw.setdefault('interpolation','nearest')
   # All other keywords go through to imshow.
   im = ax.imshow(*args,**kw)
   gci._current = im
   # set the x and y lim to equal the matrix dims
   nr,nc = arr.shape[:2]
   ax.set_xlim((0,nc))
   ax.set_ylim((nr,0))
   draw_if_interactive()
   if retall:
       return fig, ax, im
   else:
       return fig

--bb

···

On 3/17/07, Bill Baxter <wbaxter@...287...> wrote:

On 3/17/07, Fernando Perez <fperez.net@...287...> wrote:
> On 3/16/07, Bill Baxter <wbaxter@...287...> wrote:

Well, the code you pasted doesn't seem to work correctly using current
SVN (comparison between mymatshow and matshow attached).

Frankly, I don't care how it's done: I wrote matshow long ago, back
when axis('scaled') didn't exist in the first place. If the same
result can be achieved by other means that are cleaner, I'm sure John
will accept a patch.

All I need regularly in my work is the ability to plot a matrix such
that both the axis AND the enclosing figure (which determines the size
of the resulting EPS files for publications or talks) have the aspect
ratio of the actual matrix. How that result is achieved is really
immaterial to me.

matshow does what I need so I use it, but I have no particular
attachment to the code other than the fact that it happens to work
correctly. That's a bonus in my book.

Cheers,

f

···

On 3/16/07, Bill Baxter <wbaxter@...287...> wrote:

I guess that makes sense.
Personally I'd rather have consistency. I'm not sure why matshow() in
particular needs to have the window shape match the image shape.

Why not just do axis('scaled') within the confines of the window you have?
Tried it out, it seems to work pretty well, and seems more consistent
with the way other things work in pylab.

Fernando Perez wrote:
[...]

Frankly, I don't care how it's done: I wrote matshow long ago, back
when axis('scaled') didn't exist in the first place. If the same
result can be achieved by other means that are cleaner, I'm sure John
will accept a patch.

One of the matshow anomalies is that it is a pylab function only instead of a wrapper for an Axes method, so I made a new Axes.matshow(), and a temporary matshow1() pylab function that calls it. Differences between matshow() and matshow1():

1) The latter labels the *centers* of the squares representing the matrix elements, starting from zero. Tick values are consequently integers.

2) matshow1 uses the same function as matshow (figaspect()) to determine the window dimensions, but keeps the matrix elements square when they would be stretched in matshow. I can change this back to the matshow behavior if desired.

All I need regularly in my work is the ability to plot a matrix such
that both the axis AND the enclosing figure (which determines the size
of the resulting EPS files for publications or talks) have the aspect
ratio of the actual matrix. How that result is achieved is really
immaterial to me.

I suspect that what you would actually prefer is better automated figure sizing so that it would always nicely enclose the axes with their labels, titles, etc., correct? There is nothing magic about having the actual aspect ratio of the figure exactly match that of the axes box?
(Not that I can easily achieve the nice wrapping result--this is just to clarify the ideal.)

matshow does what I need so I use it, but I have no particular
attachment to the code other than the fact that it happens to work
correctly. That's a bonus in my book.

Absolutely!

Another anomaly of matshow (presently preserved in matshow1) is the returnall kwarg; this seems like the sort of thing that should either be supported by all pylab functions, or by none. The argument for none is that one can easily use gcf() and gca() to get the other two arguments. Do you want to keep the returnall kwarg?

Eric

You may recall from our previous discussions that I would rather you not change (2) back to matshow behaviour. Although I am not sure if you say you will force the aspect ratio to be equal, or that you will preserve the aspect ratio of the matrix as specified? (As you may recall, I was unhappy with the matrix being stretched when other elements were added to the figure.)

And thanks for #1.

···

On Sun, 18 Mar 2007, Eric Firing wrote:

One of the matshow anomalies is that it is a pylab function only instead
of a wrapper for an Axes method, so I made a new Axes.matshow(), and a
temporary matshow1() pylab function that calls it. Differences between
matshow() and matshow1():

1) The latter labels the *centers* of the squares representing the
matrix elements, starting from zero. Tick values are consequently integers.

2) matshow1 uses the same function as matshow (figaspect()) to determine
the window dimensions, but keeps the matrix elements square when they
would be stretched in matshow. I can change this back to the matshow
behavior if desired.

Sounds good to me.

> All I need regularly in my work is the ability to plot a matrix such
> that both the axis AND the enclosing figure (which determines the size
> of the resulting EPS files for publications or talks) have the aspect
> ratio of the actual matrix. How that result is achieved is really
> immaterial to me.

I suspect that what you would actually prefer is better automated figure
sizing so that it would always nicely enclose the axes with their
labels, titles, etc., correct? There is nothing magic about having the
actual aspect ratio of the figure exactly match that of the axes box?
(Not that I can easily achieve the nice wrapping result--this is just to
clarify the ideal.)

Yes. In fact, others have pointed the annoying mis-feature of
old-matshow where the figure is squeezed if you add for example a
colorbar.

> matshow does what I need so I use it, but I have no particular
> attachment to the code other than the fact that it happens to work
> correctly. That's a bonus in my book.

Absolutely!

Another anomaly of matshow (presently preserved in matshow1) is the
returnall kwarg; this seems like the sort of thing that should either be
supported by all pylab functions, or by none. The argument for none is
that one can easily use gcf() and gca() to get the other two arguments.
  Do you want to keep the returnall kwarg?

I honestly don't remember clearly why that was put in. John and I had
some brief discussion about it, but in practice I don't think I've
ever actually used it. So follow your judgment on this one, I have no
opinion.

Keep in mind that I wrote matshow() strictly as a quick hack to get
some functionality I needed badly (properly scaled display of matrices
with labeling along the top/left like 'normal' matrices). I knew so
little about the internals of mpl that it's no surprise the code has
problems, so by all means feel free to improve it and modify it so it
actually fits better with the overall architecture. I'm sure we'll
all benefit from such a cleanup.

Cheers,

f

···

On 3/19/07, Eric Firing <efiring@...202...> wrote:

Thanks again Eric for the updated matshow().

I apologise for repeating:

Since it has been decided (has it?) that matshow will retain the feature that a new figure is created (with aspect ratio matching the matrix), then if one adds a colorbar (a typical thing to do), the matrix height is smaller than the colorbar, which is not visually appealing. Also, it is fairly common to desire combining a matrix visualisation with other plots, and hence the new figure becomes an issue.

Of course, I guess one could use Axes.matshow() now to avoid the above. If that is to be the case, fine.

One very minor thing to note: the new matshow() is missing ticks on the lower x-axis.

Thanks again for the excellent support for a function that clearly a lot of people are using.

Cheers,
Suresh