Friends,
I have a matrix data and i used matshow() function to plot. The plot is attached.
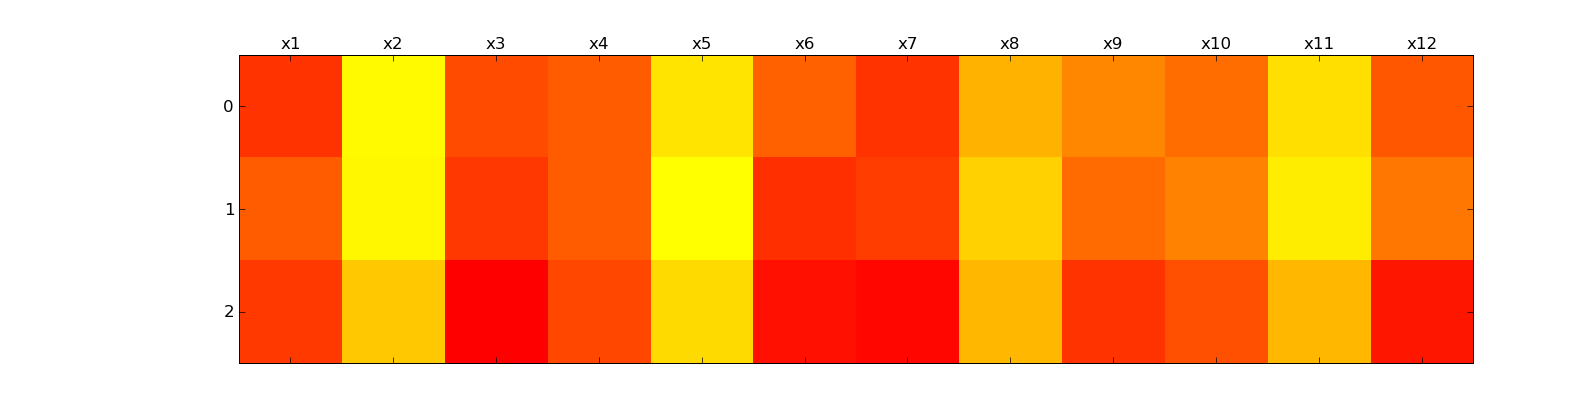
- After plotting the data, i used xticks() function to change the x-axis tick labels from x1 to x12 ( figure attached). Similarly I want to change the y-axis tick labels into as A,B and C, instead of 0,1,2 (in the attached figure) but when i use yticks() function as below, it dosent happen, instead it changes the plot.
yticks( arange(3), (‘A’,‘B’,‘C’))
- I used the colormap cm.autumn to create the plot. Suppose if i want to generate the same plot with green,black, red combination, how should i specify the colors in matshow.
Thanks in advance.
Bala
Friends,
I have a matrix data and i used matshow() function to plot. The plot is
attached.
1) After plotting the data, i used xticks() function to change the x-axis
tick labels from x1 to x12 ( figure attached). Similarly I want to change
the y-axis tick labels into as A,B and C, instead of 0,1,2 (in the attached
figure) but when i use yticks() function as below, it dosent happen, instead
it changes the plot.
yticks( arange(3), ('A','B','C'))
Can you post a complete code (a simplified version that reproduces the
problem)? I have done some simple tests but it worked as expected.
Also, please report the version number of your mpl installation.
2) I used the colormap cm.autumn to create the plot. Suppose if i want to
generate the same plot with green,black, red combination, how should i
specify the colors in matshow.
If none of the mpl's colormaps fits your need, you need to create your
own colormap.
Maybe the links below will be helpful.
http://www.scipy.org/Cookbook/Matplotlib/Show_colormaps
-JJ
···
On Thu, Sep 17, 2009 at 2:49 AM, Bala subramanian <bala.biophysics@...287...> wrote:
Thanks in advance.
Bala
------------------------------------------------------------------------------
Come build with us! The BlackBerry® Developer Conference in SF, CA
is the only developer event you need to attend this year. Jumpstart your
developing skills, take BlackBerry mobile applications to market and stay
ahead of the curve. Join us from November 9-12, 2009. Register now!
http://p.sf.net/sfu/devconf
_______________________________________________
Matplotlib-users mailing list
Matplotlib-users@lists.sourceforge.net
matplotlib-users List Signup and Options