Hello,
I think that there are a problem with matshow in the current matplotlib cvs version:
m1 = zeros((12,12))
matshow(m1,origin='upper')
matshow(m1,origin='lower')
give me exactly the same result. The lower case is not working.
N.
Hello,
I think that there are a problem with matshow in the current matplotlib cvs version:
m1 = zeros((12,12))
matshow(m1,origin='upper')
matshow(m1,origin='lower')
give me exactly the same result. The lower case is not working.
N.
Humufr wrote:
Hello,
I think that there are a problem with matshow in the current matplotlib cvs version:
m1 = zeros((12,12))
matshow(m1,origin='upper')
matshow(m1,origin='lower')give me exactly the same result. The lower case is not working.
It's not a bug, it's a feature ![]()
In [19]: matshow?
Type: function
Base Class: <type 'function'>
String Form: <function matshow at 0x411f1064>
Namespace: Interactive
File: /usr/lib/python2.3/site-packages/matplotlib/pylab.py
Definition: matshow(*args, **kw)
Docstring:
Display an array as a matrix in a new figure window.
The origin is set at the upper left hand corner and rows (first dimension
of the array) are displayed horizontally. The aspect ratio of the figure
window is that of the array, as long as it is possible to fit it within
your screen with no stretching. If the window dimensions can't accomodate
this (extremely tall/wide arrays), some stretching will inevitably occur.
Tick labels for the xaxis are placed on top by default.
Basically matshow hardcodes origin='lower', as the code shows:
# imshow call: use 'lower' origin (we'll flip axes later)
kw['origin'] = 'lower'
I thought the docstring was clear enough, by saying:
The origin is set at the upper left hand corner and rows (first dimension
of the array) are displayed horizontally.
but if you feel a more emphatic description is needed, let us know.
The intent of matshow is precisely to serve as an imshow wrapper with fixed origin at the top left for matrix-type displays. It uses imshow under the hood, so it doesn't take any fine control away from you, rather it is a specialized function for displaying arrays which are meant to be understood as matrices in the traditional linear algebra sense.
OTOH, if further functionality for it is desired, I'm sure patches would be welcome. It serves my needs fairly well, but I'm sure it can always be improved.
Cheers,
f
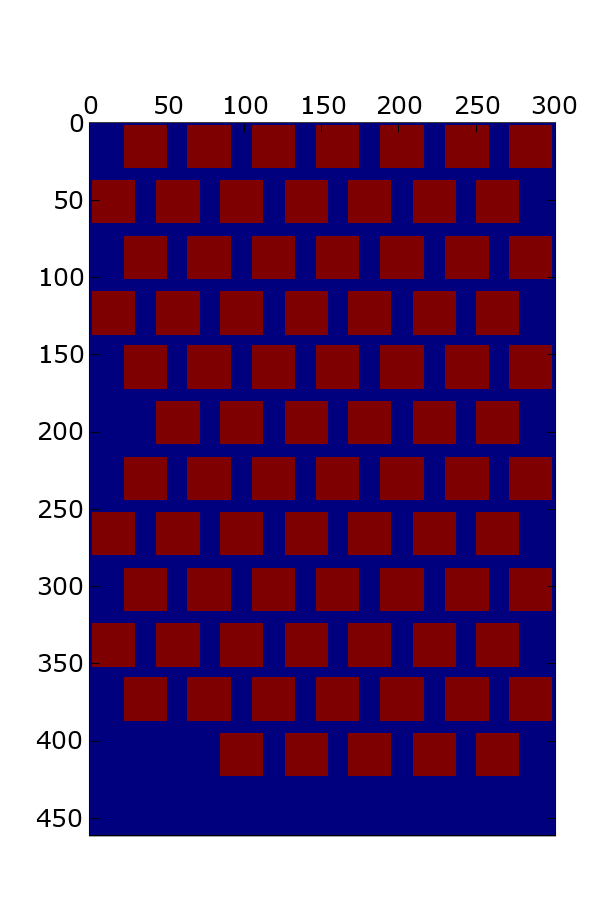
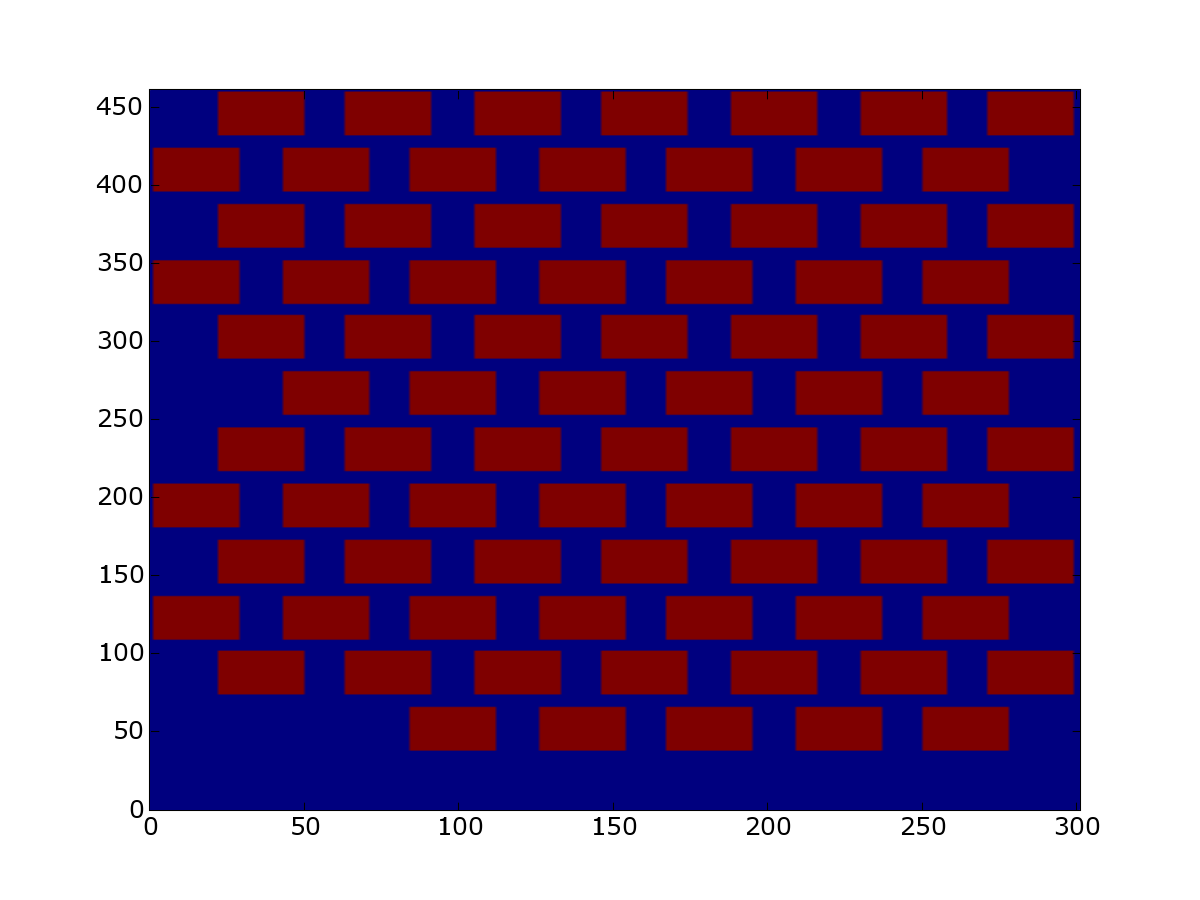
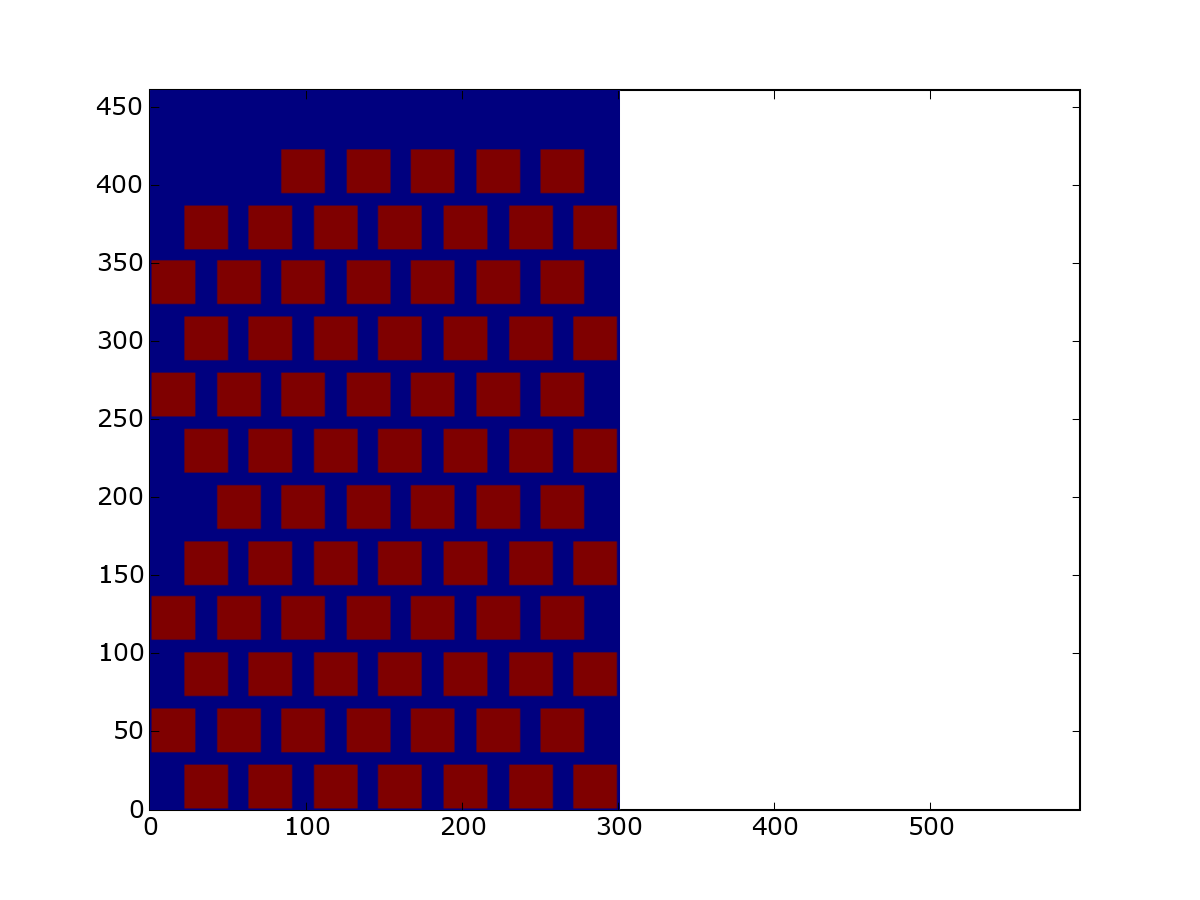
My fault, I didn't read with enougth attention the help. I have another question so:
For a same matrice with imshow and matshow. I obtain the two images include.
They are very different for the axes and the aspect.
I try to use origin and preserve with imsho to have something similar to matshow but the result are not better and for the preserve command it's worst.
I must admit I don't understand very well how this two commands work, especially for the origin where the pixels are count.
N.
Fernando Perez wrote:
Humufr wrote:
Hello,
I think that there are a problem with matshow in the current matplotlib cvs version:
m1 = zeros((12,12))
matshow(m1,origin='upper')
matshow(m1,origin='lower')give me exactly the same result. The lower case is not working.
It's not a bug, it's a feature
In [19]: matshow?
Type: function
Base Class: <type 'function'>
String Form: <function matshow at 0x411f1064>
Namespace: Interactive
File: /usr/lib/python2.3/site-packages/matplotlib/pylab.py
Definition: matshow(*args, **kw)
Docstring:
Display an array as a matrix in a new figure window.The origin is set at the upper left hand corner and rows (first dimension
of the array) are displayed horizontally. The aspect ratio of the figure
window is that of the array, as long as it is possible to fit it within
your screen with no stretching. If the window dimensions can't accomodate
this (extremely tall/wide arrays), some stretching will inevitably occur.Tick labels for the xaxis are placed on top by default.
Basically matshow hardcodes origin='lower', as the code shows:
# imshow call: use 'lower' origin (we'll flip axes later)
kw['origin'] = 'lower'I thought the docstring was clear enough, by saying:
The origin is set at the upper left hand corner and rows (first dimension
of the array) are displayed horizontally.but if you feel a more emphatic description is needed, let us know.
The intent of matshow is precisely to serve as an imshow wrapper with fixed origin at the top left for matrix-type displays. It uses imshow under the hood, so it doesn't take any fine control away from you, rather it is a specialized function for displaying arrays which are meant to be understood as matrices in the traditional linear algebra sense.
OTOH, if further functionality for it is desired, I'm sure patches would be welcome. It serves my needs fairly well, but I'm sure it can always be improved.
Cheers,
f
Humufr wrote:
My fault, I didn't read with enougth attention the help. I have another question so:
For a same matrice with imshow and matshow. I obtain the two images include.
They are very different for the axes and the aspect.
That's precisely why matshow was written, to address the aspect/size problems of using imshow when a 'matrix display' was desired.
If you want something which is similar to matshow but tuned for your own purposes, I suggest you just copy the matshow source and start modifying it. It's a short function, so you shouldn't have problems.
Cheers,
f