@MariaLukis, I had to go through contortions to plot an arbitrary quadrilateral mesh, in 3D. I resolved it by storing every line plotted and retracing the best set to take me to the starting point of the quad I was plotting. It would have been much easier if I had the function of lifting my pen and move while not plotting. But then I did not know how to get intpo matplotlib to perform what is a simple mod.
···
On Fri, Nov 21, 2014 at 6:54 AM, <matplotlib-users-request@…1064…t> wrote:
Send Matplotlib-users mailing list submissions to
matplotlib-users@lists.sourceforge.netTo subscribe or unsubscribe via the World Wide Web, visit
[https://lists.sourceforge.net/lists/listinfo/matplotlib-users](https://lists.sourceforge.net/lists/listinfo/matplotlib-users)or, via email, send a message with subject or body ‘help’ to
matplotlib-users-request@lists.sourceforge.netYou can reach the person managing the list at
matplotlib-users-owner@lists.sourceforge.netWhen replying, please edit your Subject line so it is more specific
than “Re: Contents of Matplotlib-users digest…”
Today’s Topics:
How to plot other than rectangular grid? (Maria Liukis)
Re: How to plot other than rectangular grid? (Thomas Caswell)
Re: How to plot other than rectangular grid?
(Shahar Shani Kadmiel)
Re: How to plot other than rectangular grid? (Oliver)
Re: How to plot other than rectangular grid? (Eric Firing)
Message: 1
Date: Fri, 21 Nov 2014 00:11:31 +0000
From: Maria Liukis <liukis@…4271…>
Subject: [Matplotlib-users] How to plot other than rectangular grid?
To: “matplotlib-users@lists.sourceforge.net”
<matplotlib-users@lists.sourceforge.net>Message-ID: <50316610-BE5C-45B1-9BD4-74438FF93662@…1887…>
Content-Type: text/plain; charset=“Windows-1252”
Hello,
I have a problem plotting data which is defined on a grid other than rectangular mesh, and would greatly appreciate any advise. My data is defined for 0.1degree grid for the state of California, and I don?t want to interpolate my data outside of the defined grid when plotting it. I used pcolormesh() function for rectangular area maps, but it only accepts rectangular grid and I was wondering if there is a simple solution to my problem.
The only solution I could find was to use scipy.interpolate,griddata() to ?map? my grid to a bounding rectangular grid (bounding rectangle around CA state), but that would also interpolate my data to grid cells outside of CA state, which I don?t want to do.
Many thanks for any hints!
Masha
–
liukis@…1887…
Message: 2
Date: Fri, 21 Nov 2014 04:38:21 +0000
From: Thomas Caswell <tcaswell@…83…287…>
Subject: Re: [Matplotlib-users] How to plot other than rectangular
grid?To: Maria Liukis <liukis@…1887…>,
    "matplotlib-users@lists.sourceforge.net"

    <matplotlib-users@lists.sourceforge.net>
Message-ID:
<CAA48SF86omwetH6jxKDbqo++TW=JUwt8MCnwhHuJ9RVHST14pQ@...288...>Content-Type: text/plain; charset=“utf-8”
There are also triangular mesh plotting (I think tricolormesh is the
function name).
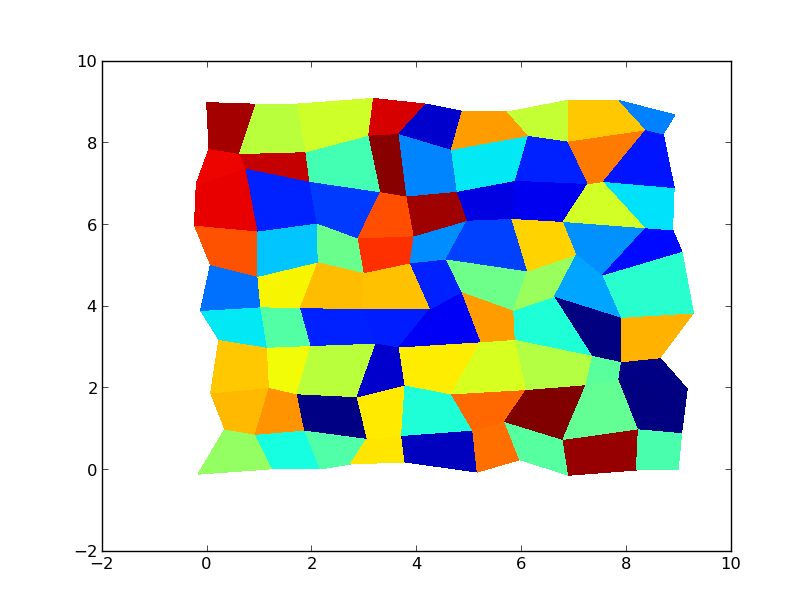
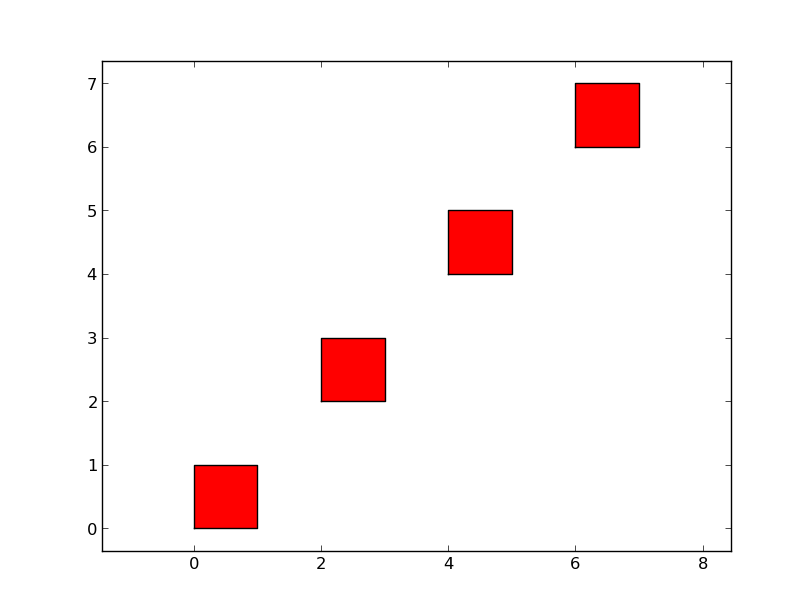
The really brute force solution is to use poly collection and draw what
ever shape you want.
Tom
-------------- next part --------------
An HTML attachment was scrubbed…
Message: 3
Date: Fri, 21 Nov 2014 00:15:58 -0800 (PST)
From: “Shahar Shani Kadmiel” <kadmiel@…4191…>
Subject: Re: [Matplotlib-users] How to plot other than rectangular
grid?To: “Maria Liukis” <liukis@…1887…>
Cc: matplotlib-users@lists.sourceforge.net
Message-ID: <1416557758097.b2298d67@…4515…>
Content-Type: text/plain; charset=“utf-8”
When using scipy.interpolate.griddada, you could use ‘nearest’ if your data is sufficiently dense. This will ‘map’ your grid onto whatever rectangular grid leaving grid points outside the convex hull of the original grid empty. Well, not empty but nan.?If you do wish to interpolate your dada, you could mask the resulting rectangular grid post interpolation.?
?
Sent from Mailbox
On Fri, Nov 21, 2014 at 2:12 AM, Maria Liukis <liukis@…1887…> wrote:
Hello,
I have a problem plotting data which is defined on a grid other than rectangular mesh, and would greatly appreciate any advise. My data is defined for 0.1degree grid for the state of California, and I don?t want to interpolate my data outside of the defined grid when plotting it. I used pcolormesh() function for rectangular area maps, but it only accepts rectangular grid and I was wondering if there is a simple solution to my problem.
The only solution I could find was to use scipy.interpolate,griddata() to ?map? my grid to a bounding rectangular grid (bounding rectangle around CA state), but that would also interpolate my data to grid cells outside of CA state, which I don?t want to do.
Many thanks for any hints!
Masha
–
liukis@…1887…
Download BIRT iHub F-Type - The Free Enterprise-Grade BIRT Server
from Actuate! Instantly Supercharge Your Business Reports and Dashboards
with Interactivity, Sharing, Native Excel Exports, App Integration & more
Get technology previously reserved for billion-dollar corporations, FREE
http://pubads.g.doubleclick.net/gampad/clk?id=157005751&iu=/4140/ostg.clktrk
Matplotlib-users mailing list
https://lists.sourceforge.net/lists/listinfo/matplotlib-users
-------------- next part --------------
An HTML attachment was scrubbed…
Message: 4
Date: Fri, 21 Nov 2014 14:13:03 +0100
From: Oliver <oliver.willekens@…287…>
Subject: Re: [Matplotlib-users] How to plot other than rectangular
grid?To: Shahar Shani Kadmiel <kadmiel@…4191…>
Cc: “matplotlib-users@lists.sourceforge.net”
<matplotlib-users@lists.sourceforge.net>Message-ID:
<CAEqQaNBqU4dDxQD0PTQXh=J23A4Q1CQU_qAZKjZ3ipBJ8neMbg@...1737......>Content-Type: text/plain; charset=“utf-8”
As Thomas Caswell said, check out the “tri…” functions. No need for
interpolation. This question recently reappeared on Stackoverflow and was
answered there as well:
https://stackoverflow.com/questions/27004422/contour-imshow-plot-for-irregular-x-y-z-data
2014-11-21 9:15 GMT+01:00 Shahar Shani Kadmiel <kadmiel@…4191…>:
When using scipy.interpolate.griddada, you could use ‘nearest’ if your
data is sufficiently dense. This will ‘map’ your grid onto whatever
rectangular grid leaving grid points outside the convex hull of the
original grid empty. Well, not empty but nan.
If you do wish to interpolate your dada, you could mask the resulting
rectangular grid post interpolation.
?
Sent from Mailbox <https://www.dropbox.com/mailbox>
On Fri, Nov 21, 2014 at 2:12 AM, Maria Liukis <liukis@…1887…> wrote:
Hello,
I have a problem plotting data which is defined on a grid other than
rectangular mesh, and would greatly appreciate any advise. My data is
defined for 0.1degree grid for the state of California, and I don?t want to
interpolate my data outside of the defined grid when plotting it. I used
pcolormesh() function for rectangular area maps, but it only accepts
rectangular grid and I was wondering if there is a simple solution to my
problem.
The only solution I could find was to use scipy.interpolate,griddata() to
?map? my grid to a bounding rectangular grid (bounding rectangle around CA
state), but that would also interpolate my data to grid cells outside of CA
state, which I don?t want to do.
Many thanks for any hints!
Masha
–
liukis@…1887…
Download BIRT iHub F-Type - The Free Enterprise-Grade BIRT Server
from Actuate! Instantly Supercharge Your Business Reports and Dashboards
with Interactivity, Sharing, Native Excel Exports, App Integration & more
Get technology previously reserved for billion-dollar corporations, FREE
http://pubads.g.doubleclick.net/gampad/clk?id=157005751&iu=/4140/ostg.clktrk
Matplotlib-users mailing list
https://lists.sourceforge.net/lists/listinfo/matplotlib-users
-------------- next part --------------
An HTML attachment was scrubbed…
Message: 5
Date: Fri, 21 Nov 2014 09:54:29 -0500
From: Eric Firing <efiring@…2543…>
Subject: Re: [Matplotlib-users] How to plot other than rectangular
grid?To: matplotlib-users@lists.sourceforge.net
Message-ID: <546F5225.9050107@…202…>
Content-Type: text/plain; charset=windows-1252; format=flowed
On 2014/11/20, 7:11 PM, Maria Liukis wrote:
Hello,
I have a problem plotting data which is defined on a grid other than
rectangular mesh, and would greatly appreciate any advise. My data is
defined for 0.1degree grid for the state of California, and I don?t
want to interpolate my data outside of the defined grid when plotting
it. I used pcolormesh() function for rectangular area maps, but it
only accepts rectangular grid and I was wondering if there is a
simple solution to my problem.
Masha,
When you say your data “is defined for a 0.1 degree grid”, that makes it
sound like it is on a quadrilateral grid, so there should be no problem
with using pcolormesh. Is it on 0.1 degree lon by 0.1 degree lat
points, but only for points within California? Then you can make a
masked array with this grid for a rectangle in which the points outside
California are masked, and the ones inside are set to your data values.
Your X and Y inputs to pcolormesh should be 2-D arrays with the
boundary values rather than the centers. It sounds like you would want
to do all this via mpl_toolkits.basemap.Basemap so that you will end up
with a properly proportioned and labeled map.
Maybe I am misinterpreting your description of your data, however.
Eric
The only solution I could find was to use
scipy.interpolate,griddata() to ?map? my grid to a bounding
rectangular grid (bounding rectangle around CA state), but that would
also interpolate my data to grid cells outside of CA state, which I
don?t want to do.
Many thanks for any hints! Masha – liukis@…1887…
Download BIRT iHub F-Type - The Free Enterprise-Grade BIRT Server
from Actuate! Instantly Supercharge Your Business Reports and Dashboards
with Interactivity, Sharing, Native Excel Exports, App Integration & more
Get technology previously reserved for billion-dollar corporations, FREE
http://pubads.g.doubleclick.net/gampad/clk?id=157005751&iu=/4140/ostg.clktrk
Matplotlib-users mailing list
https://lists.sourceforge.net/lists/listinfo/matplotlib-users
Download BIRT iHub F-Type - The Free Enterprise-Grade BIRT Server
from Actuate! Instantly Supercharge Your Business Reports and Dashboards
with Interactivity, Sharing, Native Excel Exports, App Integration & more
Get technology previously reserved for billion-dollar corporations, FREE
http://pubads.g.doubleclick.net/gampad/clk?id=157005751&iu=/4140/ostg.clktrk
Matplotlib-users mailing list
Matplotlib-users@lists.sourceforge.net
https://lists.sourceforge.net/lists/listinfo/matplotlib-users
End of Matplotlib-users Digest, Vol 102, Issue 39