Matplotlib trims off the figure plotted

Hi Everyone,

I am currently using matplotlib version 0.99 Ubuntu operating system.

I am plotting a figure whose script is as follows. The figure i get is usually trimmed off. See the attached
figure. Is there a way to solve this problem? Thanks

import numpy as np
import matplotlib.pyplot as plt

conf_arr = [[33,2,0,0,0,0,0,0,0,1,3],

            [3,31,0,0,0,0,0,0,0,0,0],

            [0,4,41,0,0,0,0,0,0,0,1],

            [0,1,0,30,0,6,0,0,0,0,1],

            [0,0,0,0,38,10,0,0,0,0,0],

            [0,0,0,3,1,39,0,0,0,0,4],

            [0,2,2,0,4,1,31,0,0,0,2],

            [0,1,0,0,0,0,0,36,0,2,0],

            [0,0,0,0,0,0,1,5,37,5,1],

            [3,0,0,0,0,0,0,0,0,39,0],

            [0,0,0,0,0,0,0,0,0,0,38]]

norm_conf = []
for i in conf_arr:

    a = 0
    tmp_arr = []

    a = sum(i, 0)

    for j in i:
        tmp_arr.append(float(j)/float(a))

    norm_conf.append(tmp_arr)

fig = plt.figure()

plt.clf()
ax = fig.add_subplot(111)

ax.set_aspect(1)
res = ax.imshow(np.array(norm_conf), cmap=plt.cm.jet,

                interpolation='nearest')

width = len(conf_arr)

height = len(conf_arr[0])

for x in xrange(width):

    for y in xrange(height):

        ax.annotate(str(conf_arr[x][y]), xy=(x, y),

                    horizontalalignment='center',
                    verticalalignment='center')

cb = fig.colorbar(res)

alphabet = 'ABCDEFGHIJKLMNOPQRSTUVWXYZ'
plt.xticks(range(width), alphabet[:width])

plt.yticks(range(height), alphabet[:height])

plt.savefig('confusion_matrix.png', format='png')
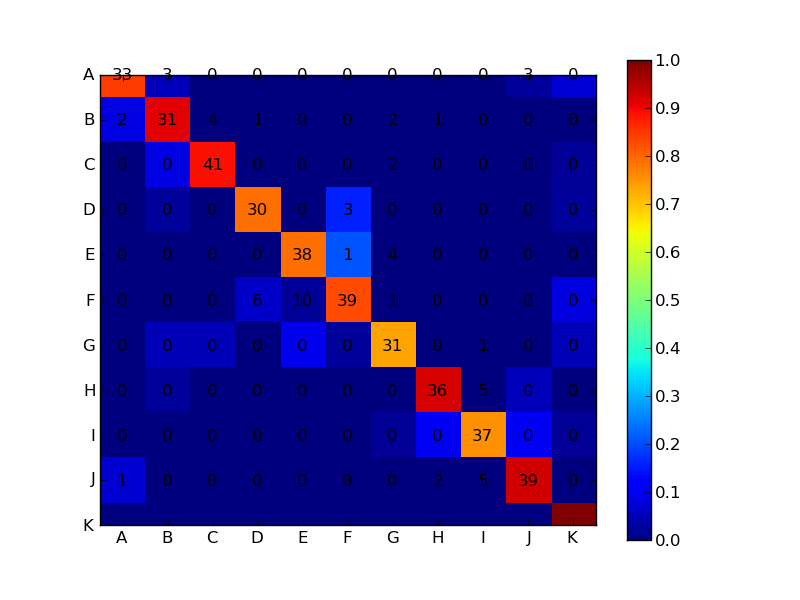
confusion_matrix.png

Musa,

I just tested your code with the latest in the development branch, and it appears that whatever bug caused your problem has since been fixed. I don’t know when the fix was made, but hopefully it made it into the v1.0.1 release.

Cheers,
Ben Root

···

On Fri, Apr 29, 2011 at 7:18 AM, Musa Gabere <musa.aims@…985…> wrote:

Hi Everyone,

I am currently using matplotlib version 0.99 Ubuntu operating system.

I am plotting a figure whose script is as follows. The figure i get is usually trimmed off. See the attached
figure. Is there a way to solve this problem? Thanks

import numpy as np
import matplotlib.pyplot as plt


conf_arr = [[33,2,0,0,0,0,0,0,0,1,3],


            [3,31,0,0,0,0,0,0,0,0,0],


            [0,4,41,0,0,0,0,0,0,0,1],


            [0,1,0,30,0,6,0,0,0,0,1],


            [0,0,0,0,38,10,0,0,0,0,0],


            [0,0,0,3,1,39,0,0,0,0,4],


            [0,2,2,0,4,1,31,0,0,0,2],


            [0,1,0,0,0,0,0,36,0,2,0],


            [0,0,0,0,0,0,1,5,37,5,1],


            [3,0,0,0,0,0,0,0,0,39,0],


            [0,0,0,0,0,0,0,0,0,0,38]]


norm_conf = []
for i in conf_arr:


    a = 0
    tmp_arr = []


    a = sum(i, 0)


    for j in i:
        tmp_arr.append(float(j)/float(a))


    norm_conf.append(tmp_arr)

fig = plt.figure()


plt.clf()
ax = fig.add_subplot(111)


ax.set_aspect(1)
res = ax.imshow(np.array(norm_conf), cmap=plt.cm.jet,


                interpolation='nearest')

width = len(conf_arr)


height = len(conf_arr[0])


for x in xrange(width):


    for y in xrange(height):


        ax.annotate(str(conf_arr[x][y]), xy=(x, y),


                    horizontalalignment='center',
                    verticalalignment='center')


cb = fig.colorbar(res)


alphabet = 'ABCDEFGHIJKLMNOPQRSTUVWXYZ'
plt.xticks(range(width), alphabet[:width])


plt.yticks(range(height), alphabet[:height])


plt.savefig('confusion_matrix.png', format='png')