Hello,
I got a big problem currently and i really hope that someone here can
help me.
I am working on some graphs that are integrated into a django app. So
far no problem. I had really no experience with matplotlib before but i
managed to create 2 of 3 graph types the way our graphics designer
wants them to be.
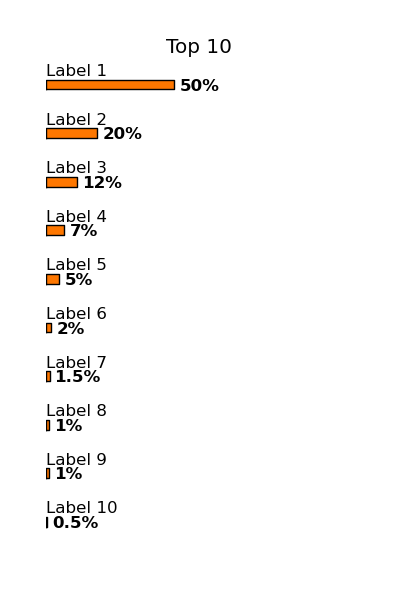
The last variation is making me really sick because it has nothing much
to do with an ordinary graph (except the fact that is has bars ;)).
Please take a look at the attachment and give me a hint how i could
realize that. I would really appreciate that.
Kind regards,
Ben
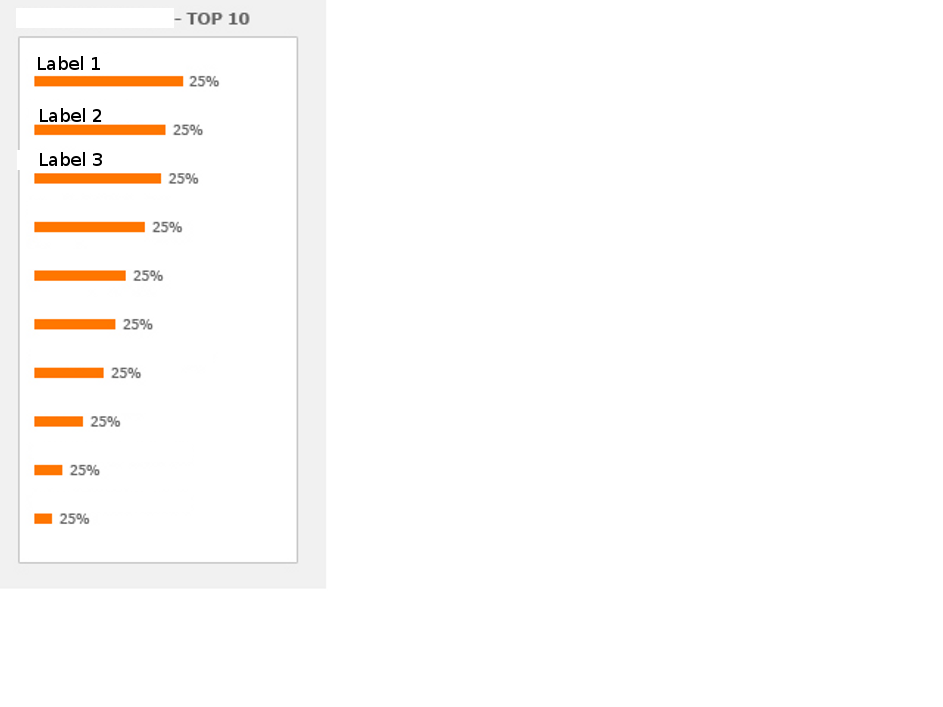
The attached example (adapted mostly from barchart_demo2.py) should guide you in the right direction.
Regards,
Jo�o Lu�s
top10.py (1.27 KB)
···
On 07/21/2010 12:27 PM, Benjamin Koep wrote:
Hello,
I got a big problem currently and i really hope that someone here can
help me.
I am working on some graphs that are integrated into a django app. So
far no problem. I had really no experience with matplotlib before but i
managed to create 2 of 3 graph types the way our graphics designer
wants them to be.
The last variation is making me really sick because it has nothing much
to do with an ordinary graph (except the fact that is has bars ;)).
Please take a look at the attachment and give me a hint how i could
realize that. I would really appreciate that.
Kind regards,
Ben
Hello João,
this was really helpful. I really appreciate your work.
Thanks so far,
Ben
···
On Wed, 21 Jul 2010 13:19:21 +0100 João Luís Silva <jsilva@...668...> wrote:
On 07/21/2010 12:27 PM, Benjamin Koep wrote:
> Hello,
>
> I got a big problem currently and i really hope that someone here
> can help me.
>
> I am working on some graphs that are integrated into a django app.
> So far no problem. I had really no experience with matplotlib
> before but i managed to create 2 of 3 graph types the way our
> graphics designer wants them to be.
>
> The last variation is making me really sick because it has nothing
> much to do with an ordinary graph (except the fact that is has
> bars ;)).
>
> Please take a look at the attachment and give me a hint how i could
> realize that. I would really appreciate that.
>
> Kind regards,
>
> Ben
>
The attached example (adapted mostly from barchart_demo2.py) should
guide you in the right direction.
Regards,
João Luís