I’m creating a few sliders on python using matplotlib, and a few of the sliders I need to have will have ranges that are quite small (such as a range from 10E-15 to 10E-8, etc.). However, when I try to get those values to show up on the slider, it stops working. The slider rectangle will still show up on the plot, and I am able to “slide” the numbers around, but it’s not showing up in the little text to the side where it shows what number the slider is at. Here’s a picture of what it looks like:
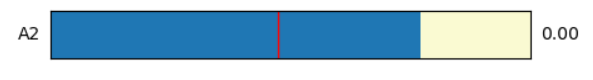
As you can see in the picture, the label will be stuck at “0.00” no matter how much I move the slider around.
I suspect it’s because the numbers for the slider range is so small, like at 10E-15, but how to I get the slider label to show that?. Is this just a bug within the Slider function?
Here is an example of the code I used to make one of such sliders.
a2_size = plt.axes([0.4, 0.1, 0.25, 0.05], facecolor = axcolor)
a2_slider = Slider(a2_size, ‘A2’, valmin=math.pow(10,-15), valmax=math.pow(10,-10), valinit=a2)
a2_slider.label.set_size(18)
Any help would be appreciated, I am still pretty new to using Python (only a couple of weeks, in fact) so an explanation in simple terms would be very appreciated.