matplotlib issue: cannot auto-scale X axis of plop properly
Hey everyone,
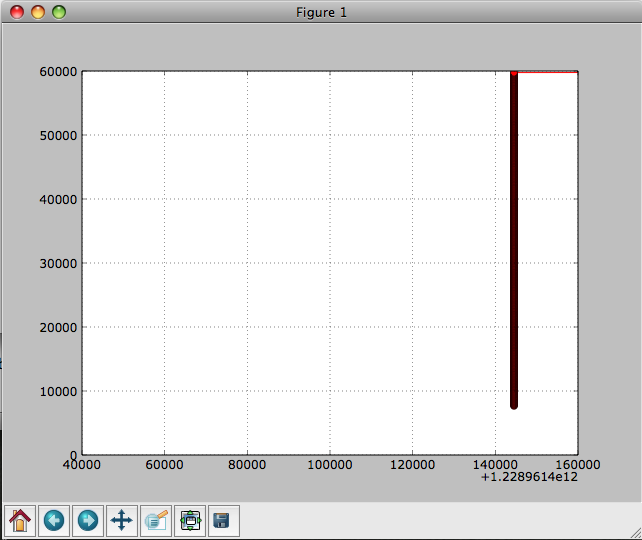
I’m fairly new to matplotlib, but have read through tons of the documentation today and have a decent understanding of it. All the auto-scaling, xlim, and x_bound stuff works fine for me with the examples, but as soon as I try to use it on my data, it’s not working for me. I’ve attached a demo script, 2 input files of data, and a PNG showing the resulting chart I get. The numbers on my Y-axis range from 7656 to 59928 (a difference of 52272) and the numbers on my X-axis range from 1.22896144017e+12 to 1.22896155012e+12 (a difference of 109950).
The plot should look like a monotonically increasing line, but the resulting plot always comes out looking like a vertical line. I realize that the plot is actually correct, the problem is the default scaling on the ouptut. The easy way to justify this to yourself is to take the line “ert = float(i)” in the script and replace it with “ert = float(i) - 1228960000000” to reduce the ert #'s to a manageable size and then everything plots very nicely. The data is all linear, not logarithmic or anything, so I don’t think writing a custom scaler is the solution.
I left commented out sections in my script of all the different methods I’ve tried to scale this thing. I’ve tried all permutations I could think of for the following functions:
matplotlib.pyplot.axes().autoscale_view(…)
matplotlib.pyplot.axes().set_xbound(…)
matplotlib.pyplot.axes().set_xlim(…)
matplotlib.pyplot.axes().set_aspect(…)
matplotlib.pyplot.axis(…)
matplotlib.pyplot.axes().set_xscale(…)
Can anyone catch what I’m doing wrong here? I’m hoping it’s just something obvious due to my unfamiliarity with the tool.
Is there any way to write my own custom autoscale algorithm?
Thanks very much for your time/help!
~Brent
PS ~ Here’s my OS info:
MacBook Pro Laptop
Mac O X 10.5.6
2.6 GHz Intel Core 2 Duo
4GB 667 MHz DDR2 SDRAM
erts.txt (8.89 KB)
matplotlib_scale_problem.py (1.37 KB)
samples.txt (5.29 KB)