![]() Hi folks,
Hi folks,
We would like to invite you to join the the Scientific Python Alt-Text workshop [1] happening this Friday, May 13th @ 1PM UTC. You will learn how to communicate science more accessibly! This is particularly relevant to the Matplotlib Community since most of the viz which will get alt-text during this event are from our (former) blog posts, which recently moved to the Scientific Python blog [2]. So you might consider joining if you’re interested in contributing alt-test to your own post, if you have written for us before, or if you just want to learn how to write informative alt-text for viz ![]() .
.
Here are all the details:
Help us make open source Scientific Python more accessible! Join our workshop with Isabela Presedo-Floyd, Mars Bar Lee, and Pamphile Roy, where we will learn how to add image descriptions ![]() to blogposts, documentation and diagrams
to blogposts, documentation and diagrams ![]() . For more information on how to attend check out: https://hackmd.io/bfhftUCiTRqx2S8CTGUt6g
. For more information on how to attend check out: https://hackmd.io/bfhftUCiTRqx2S8CTGUt6g
Images are powerful ![]()
![]() , but not everyone can access them. People with visual disabilities use alt-text to understand images. Here’s an example:
, but not everyone can access them. People with visual disabilities use alt-text to understand images. Here’s an example:
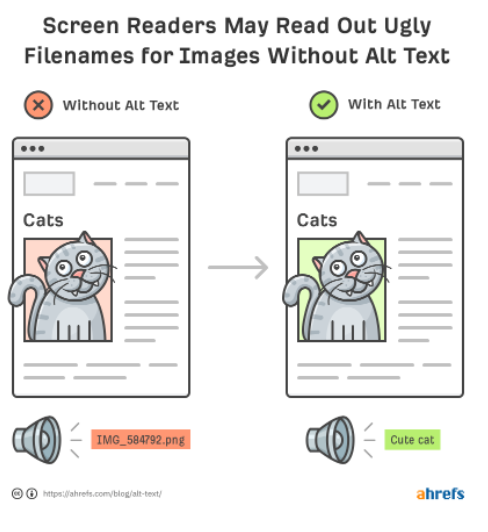
Alt-Text: Two examples highlighting how alt-text helps screen-reader users. Both example have an image of a cat. In the first example, the screen-reader reads out ‘IMG_584729.png’. In the second example, the screen-reader reads out ‘Cute cat’.
However, Scientific Python faces a unique challenge when it comes to accessibility. It’s a bit more difficult to write alt-text for complex images, such as graphs ![]() or documentation
or documentation ![]() . Don’t worry, with this workshop we’ll learn how to do that!
. Don’t worry, with this workshop we’ll learn how to do that! ![]()
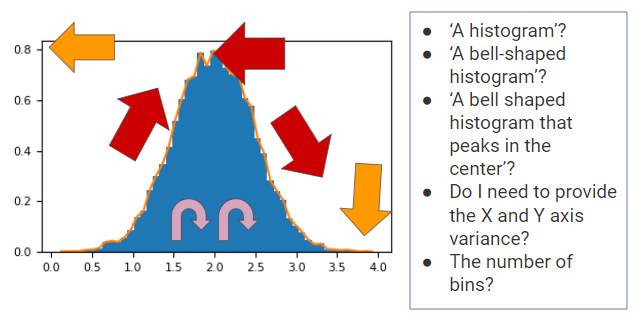
Alt-text: A histogram with multiple arrows pointing at various properties of a graph, such as shape and variance. To the side, various questions about on how to write alt-text for this histogram.
···
—
This is a wonderful opportunity to learn about accessibility & alt text for viz, and to refine your communication skills. The workshop is led by experienced UX and accessibility folk!
Hope to see you there! ![]()
Noa (she/her)