Guess I’ll be closing this:
https://github.com/matplotlib/matplotlib/pull/3858
-paul
Nice PR! That does a heck of a lot better job than my (way too simplistic) example.
···
On Fri, Jun 5, 2015 at 10:05 PM, Jody Klymak <jklymak@…4192…> wrote:
Hi Eric,
OK, how about an example based on the following notebook:
http://nbviewer.ipython.org/url/web.uvic.ca/~jklymak/matplotlib/MatplotlibNormExamples.ipynb
Those are extremely nice examples, by the way!
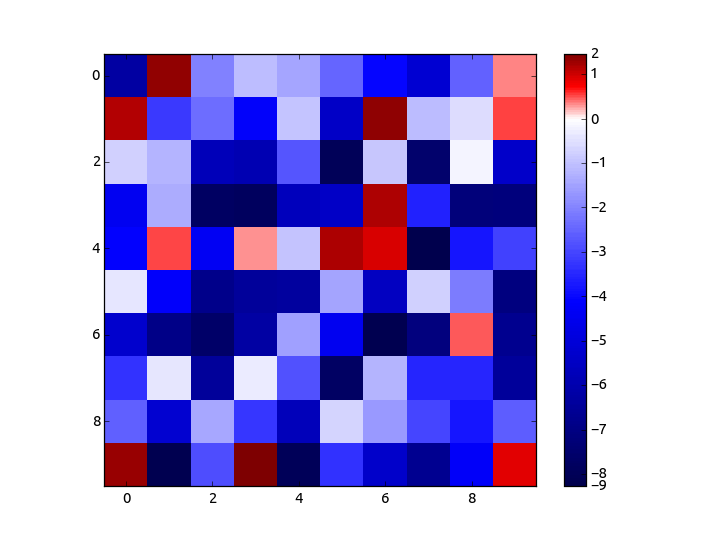
This is great, but it has a slightly bothersome side effect on the
colorbar ticks. In your original example, I changed the line ‘data =
10 * (data - 0.8)’ to ‘data = 10 * (data - 0.85)’, so that the
numbers are now in between -8.5 and +1.5. As a result, when the
colorbar is drawn, you get a tick at -8, as well as one at -9
(similarly at +1 and +2). Example attached. As in, the colorbar
method seems intent on adding those tick marks at -9 and +2. The
result is not aesthetically pleasing.
In one of my real-data example, the minimum value of the data
happened to be -4.003, and as a result there was a tick label at -4
and an overlapping tick label at -5. Why does this happen only when
I specify ‘norm’ in imshow? How do I get matplotlib to not do that?
Thanks,
Sourish
JoeKington.py (821 Bytes)
···
On 06/05/2015 03:57 PM, Joe Kington wrote:
Not to plug one of my own answers to much, but here's
a basic example. http://stackoverflow.com/questions/20144529/shifted-colorbar-matplotlib
I've been meeting to submit a PR with a more full
featured version for a few years now, but haven’t.
On Jun 5, 2015 4:45 PM, "Sourish Basu"
<sourish.basu@…287… >
wrote:
On 06/05/2015 01:20 PM, Eric Firing wrote:
Reminder: in matplotlib, color mapping is done with the combination of a colormap and a norm. This allows one to design a norm to handle the mapping, including any nonlinearity or difference between the handling of positive and negative values. This is more general than customizing a colormap; once you have a norm to suit your purpose, you can use it with any colormap.
Maybe this is actually what you are already doing, but I wanted to point it out here in case some readers are not familiar with this colormap+norm strategy.
Actually, I didn't use norms because I never quite figured
out how to use them or how to make my own. If there’s a way
to create a norm with a custom mid-point, I’d love to
know/use that.
-Sourish
Eric
------------------------------------------------------------------------------
_______________________________________________
Matplotlib-users mailing list
Matplotlib-users@lists.sourceforge.net
[https://lists.sourceforge.net/lists/listinfo/matplotlib-users](https://lists.sourceforge.net/lists/listinfo/matplotlib-users)
–
Q: What if you strapped C4 to a boomerang? Could
this be an effective weapon, or would it be as stupid as
it sounds?
A: Aerodynamics aside, I’m curious what tactical
advantage you’re expecting to gain by having the high
explosive fly back at you if it misses the target.
      _______________________________________________

      Matplotlib-users mailing list

      Matplotlib-users@lists.sourceforge.net

      [https://lists.sourceforge.net/lists/listinfo/matplotlib-users](https://lists.sourceforge.net/lists/listinfo/matplotlib-users)
–
Q: What if you strapped C4 to a boomerang? Could this be an
effective weapon, or would it be as stupid as it sounds?
A: Aerodynamics aside, I’m curious what tactical advantage
you’re expecting to gain by having the high explosive fly back at
you if it misses the target.