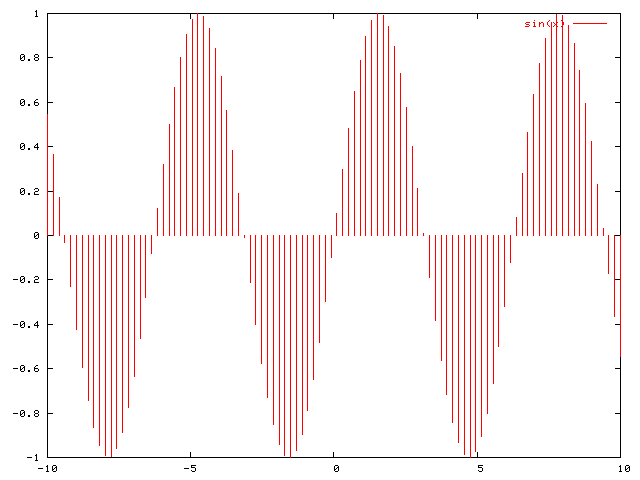
With gnuplot one can do a plot like that :
http://www.deqnotes.net/gnuplot/images/impulses.png
It is using option “with impulse”.
Is there an equivalent in matplotlib?
With gnuplot one can do a plot like that :
http://www.deqnotes.net/gnuplot/images/impulses.png
It is using option “with impulse”.
Is there an equivalent in matplotlib?
In [5]: t = arange(0.0, 2.0, 0.05)
In [6]: s = sin(2*pi*t)
In [7]: vlines(t, 0, s)
Out[7]: <matplotlib.collections
On 5/3/07, Emmanuel <emmanuel@...1321...> wrote:
With gnuplot one can do a plot like that :
http://www.deqnotes.net/gnuplot/images/impulses.png
It is using option "with impulse".
Is there an equivalent in matplotlib?
2007/5/11, John Hunter <jdh2358@...287...>:
On 5/3/07, Emmanuel <emmanuel@...1321...> wrote:
> With gnuplot one can do a plot like that :
>
> http://www.deqnotes.net/gnuplot/images/impulses.png
>
> It is using option "with impulse".
> Is there an equivalent in matplotlib?In [5]: t = arange(0.0, 2.0, 0.05)
In [6]: s = sin(2*pi*t)
In [7]: vlines(t, 0, s)
Out[7]: <matplotlib.collections
You are right! Very nice :-).
~ Antonio