Hi
1)
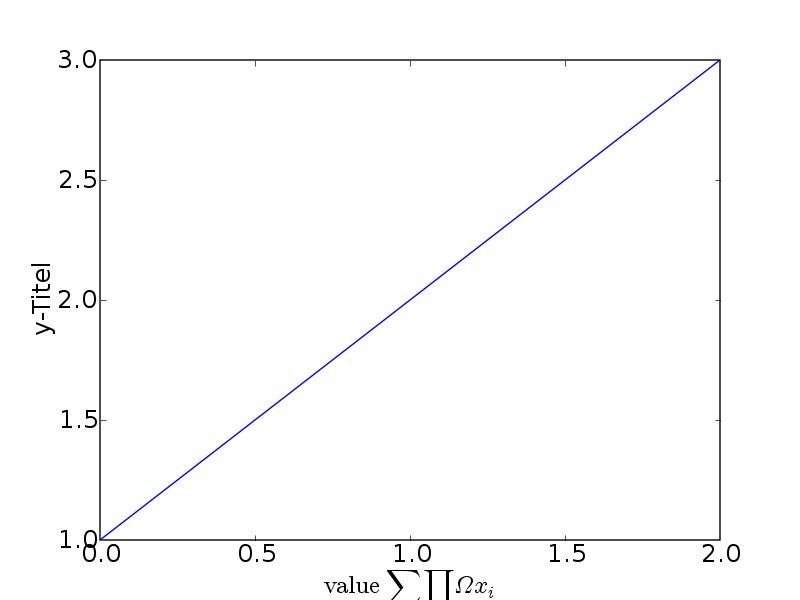
Using the recent svn version I get axes labels which are partially cut off when using mathtext (*no* usetex) and increasing the font size (see attached "image_cut.png"):
rcParams['xtick.labelsize'] = 18
rcParams['ytick.labelsize'] = 18
rcParams['axes.labelsize'] = 18
plot([1,2,3])
xlabel(r'$\rm{value}\ \sum\prod\Omega x_i$')
ylabel('y-Titel')
savefig("image_cut.png")
I observed this with .png, jpg and .eps
2)
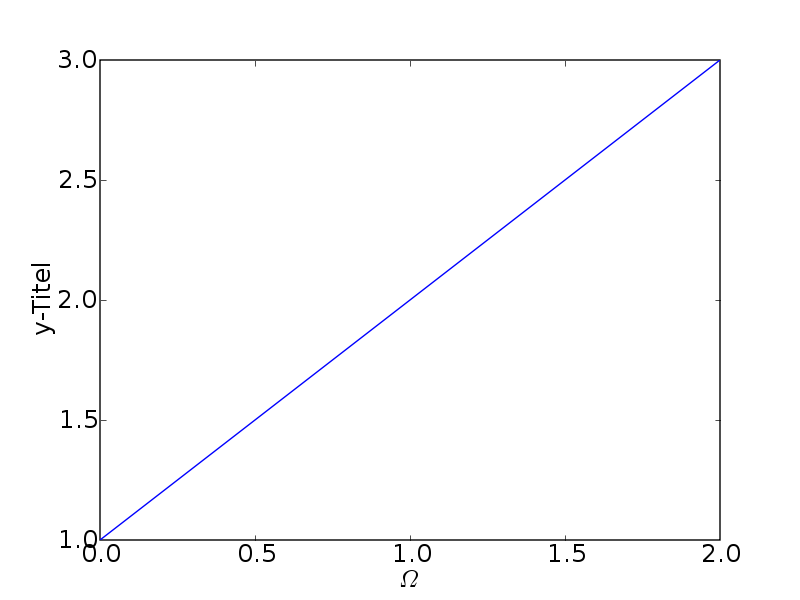
Is it possible for the "\Omega" in "image_omega.png" to be upright (like it would be for usetex=True) and not inclined?
rcParams['xtick.labelsize'] = 18
rcParams['ytick.labelsize'] = 18
rcParams['axes.labelsize'] = 18
plot([1,2,3])
xlabel(r'$\Omega$')
ylabel('y-Titel')
savefig("image_omega.png")
cheers,
steve
···
--
Random number generation is the art of producing pure gibberish as quickly as possible.
Hi
1)
Using the recent svn version I get axes labels which are partially cut
off when using mathtext (*no* usetex) and increasing the font size (see
attached "image_cut.png"):
rcParams['xtick.labelsize'] = 18
rcParams['ytick.labelsize'] = 18
rcParams['axes.labelsize'] = 18
plot([1,2,3])
xlabel(r'\\rm\{value\}\\ \\sum\\prod\\Omega x\_i')
ylabel('y-Titel')
savefig("image_cut.png")
I observed this with .png, jpg and .eps
As I mentioned for Ryan's question, try manually positioning your axes to
leave enough room for your axes labels in the figure window.
2)
Is it possible for the "\Omega" in "image_omega.png" to be upright (like
it would be for usetex=True) and not inclined?
rcParams['xtick.labelsize'] = 18
rcParams['ytick.labelsize'] = 18
rcParams['axes.labelsize'] = 18
plot([1,2,3])
xlabel(r'\\Omega')
ylabel('y-Titel')
savefig("image_omega.png")
I have to punt, I dont know the answer to this one.
Darren
···
On Monday 06 March 2006 7:56 pm, Steve Schmerler wrote: