Hi,
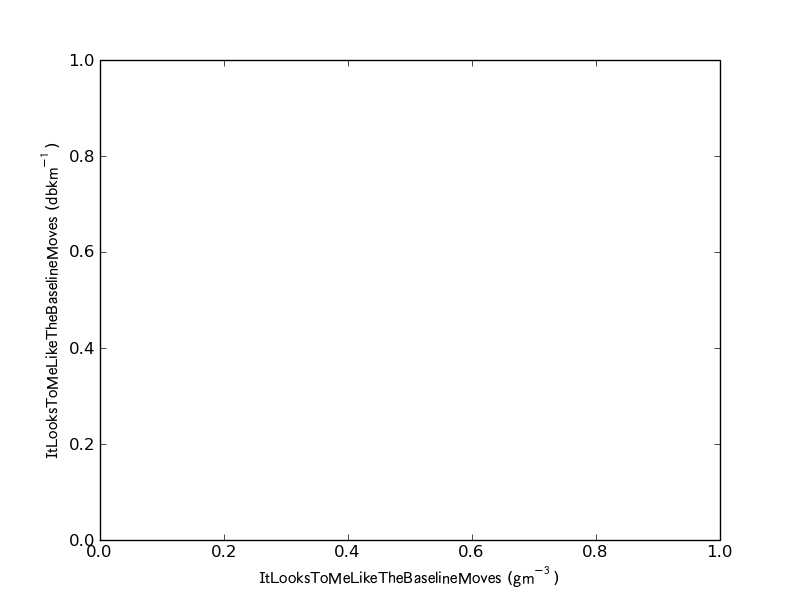
When I combine mathtext with the stixsans fonts while mathtext.default is set to ‘regular’, horizontal text is not vertically aligned properly, like the baseline is moving. I’ve attached an image of what I see when I run the following code. It should be noted that I don’t see anything like this on the vertical axis, and it all goes away if I stop using mathtext.
import matplotlib.pyplot as plt
from matplotlib import rcParams
rcParams[‘font.size’] = 12.0
rcParams[‘mathtext.default’] = ‘regular’
rcParams[‘mathtext.fontset’] = ‘stixsans’
fig = plt.figure()
plt.xlabel(‘ItLooksToMeLikeTheBaselineMoves $(g m^{-3})$’)
plt.ylabel(‘ItLooksToMeLikeTheBaselineMoves $(db km^{-1})$’)
plt.show()
Thoughts? Am I doing something bad? Can anyone else reproduce this?
Ryan
···
–
Ryan May
Graduate Research Assistant
School of Meteorology
University of Oklahoma
Sent from: Norman Oklahoma United States.
And here’s the image I promised.
···
On Wed, Feb 25, 2009 at 3:13 PM, Ryan May <rmay31@…287…> wrote:
Hi,
When I combine mathtext with the stixsans fonts while mathtext.default is set to ‘regular’, horizontal text is not vertically aligned properly, like the baseline is moving. I’ve attached an image of what I see when I run the following code. It should be noted that I don’t see anything like this on the vertical axis, and it all goes away if I stop using mathtext.
import matplotlib.pyplot as plt
from matplotlib import rcParams
rcParams[‘font.size’] = 12.0
rcParams[‘mathtext.default’] = ‘regular’
rcParams[‘mathtext.fontset’] = ‘stixsans’
fig = plt.figure()
plt.xlabel(‘ItLooksToMeLikeTheBaselineMoves (g m^{-3})’)
plt.ylabel(‘ItLooksToMeLikeTheBaselineMoves (db km^{-1})’)
plt.show()
Thoughts? Am I doing something bad? Can anyone else reproduce this?
Ryan
–
Ryan May
Graduate Research Assistant
School of Meteorology
University of Oklahoma
Sent from: Norman Oklahoma United States.
–
Ryan May
Graduate Research Assistant
School of Meteorology
University of Oklahoma
Sent from: Norman Oklahoma United States.
It seems the Freetype rendering backend wasn't doing subpixel alignment on the text, but was being rounded to the nearest pixels. Taking the fractional part into account seems to resolve this. Fixed on branch and trunk.
Mike
Ryan May wrote:
···
And here's the image I promised.
On Wed, Feb 25, 2009 at 3:13 PM, Ryan May <rmay31@...287... > <mailto:rmay31@…287…>> wrote:
Hi,
When I combine mathtext with the stixsans fonts while
mathtext.default is set to 'regular', horizontal text is not
vertically aligned properly, like the baseline is moving. I've
attached an image of what I see when I run the following code. It
should be noted that I don't see anything like this on the
vertical axis, and it all goes away if I stop using mathtext.
import matplotlib.pyplot as plt
from matplotlib import rcParams
rcParams['font.size'] = 12.0
rcParams['mathtext.default'] = 'regular'
rcParams['mathtext.fontset'] = 'stixsans'
fig = plt.figure()
plt.xlabel('ItLooksToMeLikeTheBaselineMoves \(g m^\{\-3\}\)')
plt.ylabel('ItLooksToMeLikeTheBaselineMoves \(db km^\{\-1\}\)')
plt.show()
Thoughts? Am I doing something bad? Can anyone else reproduce this?
Ryan
-- Ryan May
Graduate Research Assistant
School of Meteorology
University of Oklahoma
Sent from: Norman Oklahoma United States.
--
Ryan May
Graduate Research Assistant
School of Meteorology
University of Oklahoma
Sent from: Norman Oklahoma United States.
------------------------------------------------------------------------
------------------------------------------------------------------------
------------------------------------------------------------------------------
Open Source Business Conference (OSBC), March 24-25, 2009, San Francisco, CA
-OSBC tackles the biggest issue in open source: Open Sourcing the Enterprise
-Strategies to boost innovation and cut costs with open source participation
-Receive a $600 discount off the registration fee with the source code: SFAD
http://p.sf.net/sfu/XcvMzF8H
------------------------------------------------------------------------
_______________________________________________
Matplotlib-users mailing list
Matplotlib-users@lists.sourceforge.net
matplotlib-users List Signup and Options
--
Michael Droettboom
Science Software Branch
Operations and Engineering Division
Space Telescope Science Institute
Operated by AURA for NASA
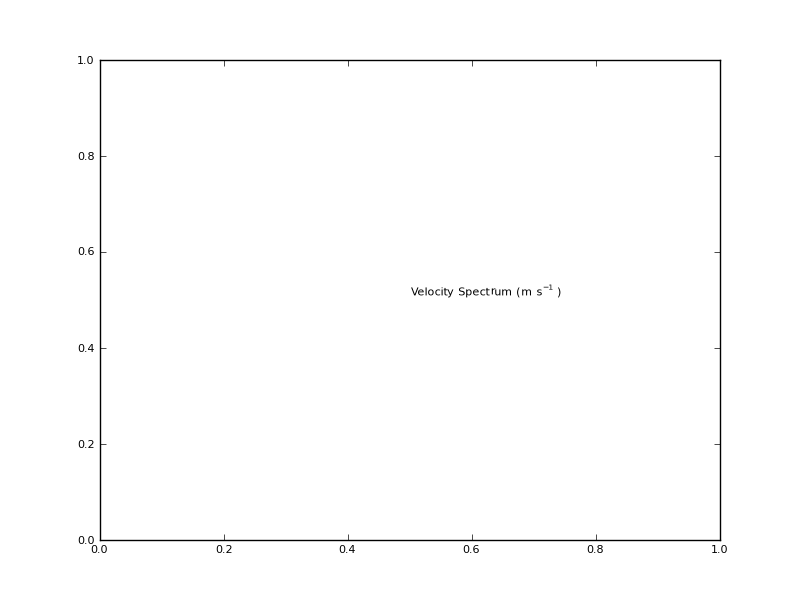
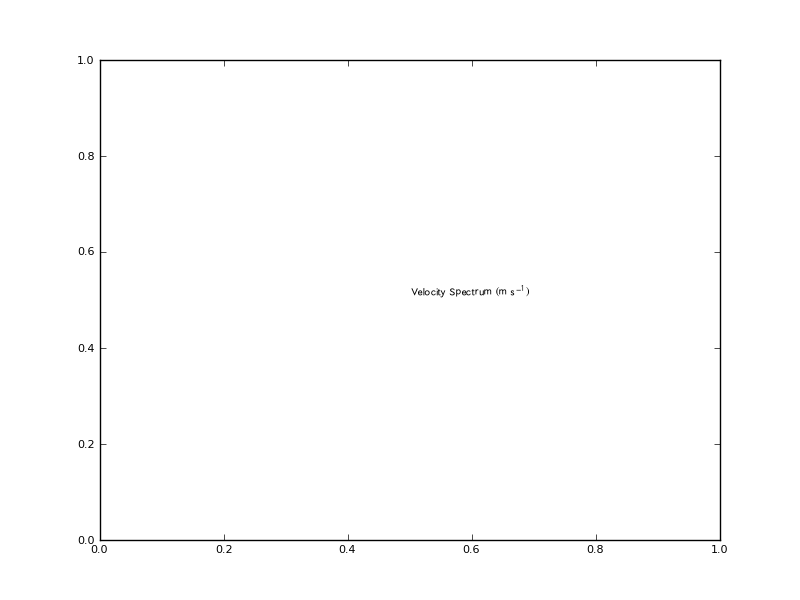
I'm having a problem with the rendering of stixsans fonts again. Not
as bad as the baseline before, but some odd text placement:
import matplotlib.pyplot as plt
from matplotlib import rcParams
rcParams['font.size'] = 8.0
rcParams['mathtext.default'] = 'regular'
rcParams['mathtext.fontset'] = 'stixsans'
fig = plt.figure(dpi=100)
plt.text(0.5,0.5,'Velocity \\,Spectrum \\, \(m \\,s^\{\-1\}\)')
plt.show()
I've attached images from both the 'regular' setting above and for
'mathtext.default' set to 'rm', which actually makes things
worse. It's also quite noticable for larger font sizes with 'rm'.
Thoughts?
Ryan
···
On Wed, Feb 25, 2009 at 4:13 PM, Ryan May <rmay31@...287...> wrote:
Hi,
When I combine mathtext with the stixsans fonts while mathtext.default is
set to 'regular', horizontal text is not vertically aligned properly, like
the baseline is moving. I've attached an image of what I see when I run the
following code. It should be noted that I don't see anything like this on
the vertical axis, and it all goes away if I stop using mathtext.
import matplotlib.pyplot as plt
from matplotlib import rcParams
rcParams['font.size'] = 12.0
rcParams['mathtext.default'] = 'regular'
rcParams['mathtext.fontset'] = 'stixsans'
fig = plt.figure()
plt.xlabel('ItLooksToMeLikeTheBaselineMoves \(g m^\{\-3\}\)')
plt.ylabel('ItLooksToMeLikeTheBaselineMoves \(db km^\{\-1\}\)')
plt.show()
Thoughts? Am I doing something bad? Can anyone else reproduce this?
Ryan
--
Ryan May
Graduate Research Assistant
School of Meteorology
University of Oklahoma
Sent from: Norman Oklahoma United States.
--
Ryan May
Graduate Research Assistant
School of Meteorology
University of Oklahoma


