Mike,
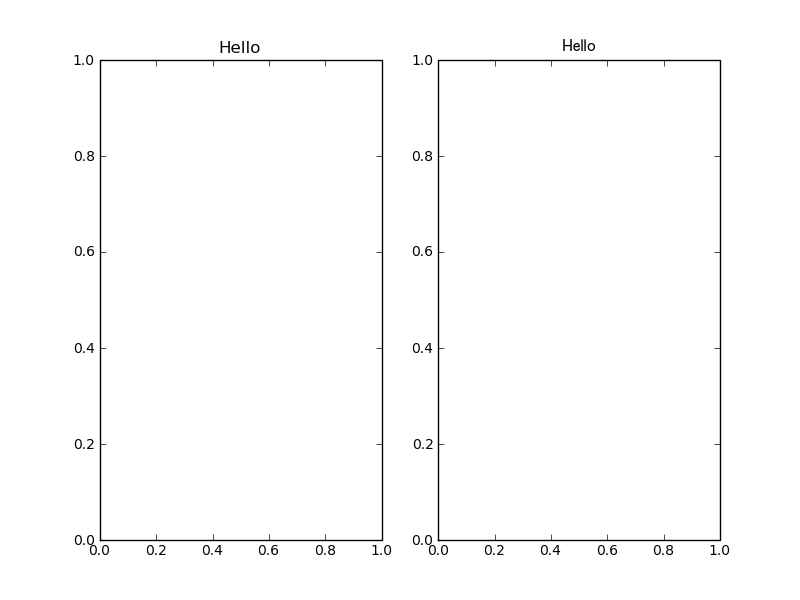
Is there supposed to be a difference in the size of text printed with and without mathtext? Here’s a simple script that shows what I’m talking about:
import matplotlib.pyplot as plt
f = plt.figure()
ax1 = f.add_subplot(1,2,1)
ax1.set_title(‘Hello’)
ax2 = f.add_subplot(1,2,2)
ax2.set_title(’$Hello$’)
plt.show()
And here’s my matplotlibrc:
backend : GtkAgg
mathtext.fontset : stixsans
font.size : 10.0
savefig.dpi : 100 # figure dots per inch
mathtext.default : regular
I’ve attached a copy of what that looks like on my system.
Sorry I keep finding these things. 
Ryan
···
–
Ryan May
Graduate Research Assistant
School of Meteorology
University of Oklahoma
Sent from: Norman Oklahoma United States.
They're actually different fonts. The one on the left is Vera Sans, the one on right is Stix Sans. There is a bug where regular (meaning Vera) text in math was getting mapping to Stix Sans when mathtext.fontset is set to stixsans. (This should now be fixed in SVN).
All that said, fixing this "bug" will mean it's now fairly easy to get an unintended mix of Vera Sans and Stix Sans in math expressions. For example, "A \\bf\{A\}" will draw the first A in Vera and the second in STIX. There's no easy way around that, since we don't currently support rich text for non-math fonts. To avoid this mix of fonts within the , you would probably want to set mathtext.default to "rm".
Mike
Ryan May wrote:
···
Mike,
Is there supposed to be a difference in the size of text printed with and without mathtext? Here's a simple script that shows what I'm talking about:
import matplotlib.pyplot as plt
f = plt.figure()
ax1 = f.add_subplot(1,2,1)
ax1.set_title('Hello')
ax2 = f.add_subplot(1,2,2)
ax2.set_title('Hello')
plt.show()
And here's my matplotlibrc:
backend : GtkAgg
mathtext.fontset : stixsans
font.size : 10.0
savefig.dpi : 100 # figure dots per inch
mathtext.default : regular
I've attached a copy of what that looks like on my system.
Sorry I keep finding these things. 
Ryan
--
Ryan May
Graduate Research Assistant
School of Meteorology
University of Oklahoma
Sent from: Norman Oklahoma United States.
------------------------------------------------------------------------
------------------------------------------------------------------------
------------------------------------------------------------------------------
Apps built with the Adobe(R) Flex(R) framework and Flex Builder(TM) are
powering Web 2.0 with engaging, cross-platform capabilities. Quickly and
easily build your RIAs with Flex Builder, the Eclipse(TM)based development
software that enables intelligent coding and step-through debugging.
Download the free 60 day trial. http://p.sf.net/sfu/www-adobe-com
------------------------------------------------------------------------
_______________________________________________
Matplotlib-users mailing list
Matplotlib-users@lists.sourceforge.net
matplotlib-users List Signup and Options
--
Michael Droettboom
Science Software Branch
Operations and Engineering Division
Space Telescope Science Institute
Operated by AURA for NASA
Awesome. Thanks for the quick fix and the tip about using ‘rm’.
Ryan
···
On Thu, Mar 19, 2009 at 9:43 AM, Michael Droettboom <mdroe@…86…> wrote:
They’re actually different fonts. The one on the left is Vera Sans, the one on right is Stix Sans. There is a bug where regular (meaning Vera) text in math was getting mapping to Stix Sans when mathtext.fontset is set to stixsans. (This should now be fixed in SVN).
All that said, fixing this “bug” will mean it’s now fairly easy to get an unintended mix of Vera Sans and Stix Sans in math expressions. For example, “A \bf{A}” will draw the first A in Vera and the second in STIX. There’s no easy way around that, since we don’t currently support rich text for non-math fonts. To avoid this mix of fonts within the , you would probably want to set mathtext.default to “rm”.
Mike
Ryan May wrote:
Mike,
Is there supposed to be a difference in the size of text printed with and without mathtext? Here’s a simple script that shows what I’m talking about:
import matplotlib.pyplot as plt
f = plt.figure()
ax1 = f.add_subplot(1,2,1)
ax1.set_title(‘Hello’)
ax2 = f.add_subplot(1,2,2)
ax2.set_title(‘Hello’)
plt.show()
And here’s my matplotlibrc:
backend : GtkAgg
mathtext.fontset : stixsans
font.size : 10.0
savefig.dpi : 100 # figure dots per inch
mathtext.default : regular
I’ve attached a copy of what that looks like on my system.
Sorry I keep finding these things.
Ryan
–
Ryan May
Graduate Research Assistant
School of Meteorology
University of Oklahoma
Sent from: Norman Oklahoma United States.
Apps built with the Adobe(R) Flex(R) framework and Flex Builder™ are
powering Web 2.0 with engaging, cross-platform capabilities. Quickly and
easily build your RIAs with Flex Builder, the Eclipse™based development
software that enables intelligent coding and step-through debugging.
Download the free 60 day trial. http://p.sf.net/sfu/www-adobe-com
Matplotlib-users mailing list
Matplotlib-users@lists.sourceforge.net
https://lists.sourceforge.net/lists/listinfo/matplotlib-users
–
Michael Droettboom
Science Software Branch
Operations and Engineering Division
Space Telescope Science Institute
Operated by AURA for NASA
–
Ryan May
Graduate Research Assistant
School of Meteorology
University of Oklahoma
Sent from: Norman Oklahoma United States.