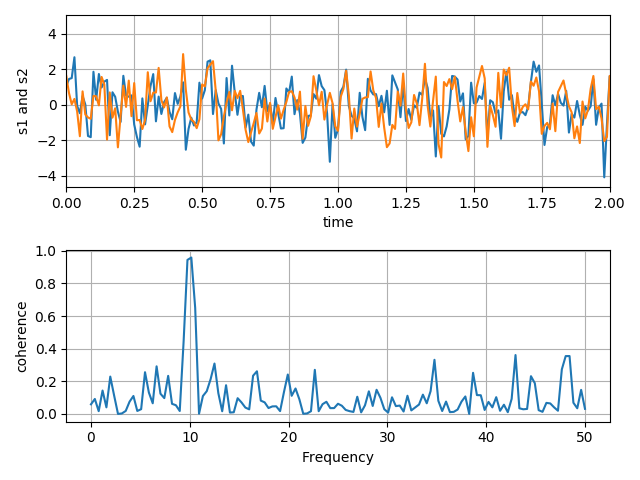
I’m an intern at a company that wants me to write some code that will help streamline the testing process of their hardware. I’m using matplotlib to make functions that create plots so that the person using the functions can pass the data to the functions and have plots generated as opposed to making the plots line by line. I’ve written a function that plots multiple graphs onto one plot, and another that can plot subplots where each subplot only contains one graph. I’d like to make a function that can combine these two outcomes so that any subplot in a figure can contain multiple graphs (like in the image below). My idea was to first create a figure that has multiple graphs on one plot and pass it into a function that makes subplots, but this seems to be impossible, as figures cannot be passed as arguments. I’d greatly appreciate any ideas as to how else I might be able to approach this problem.

Can you clarify this a bit with some pseudo code? I’m not following what you are trying to accomplish.
I was able to do this by passing tuples of a class I made called Variable into the function. A Variable contains a name, data, and labels for x and y axes. I’m using this to plot data pulled from a .mat file. Here’s the code for it:
    def plotSubplots(title, row, col, *variable, **stylesheet):
          i=1
          plt.suptitle(title, weight=stylesheet.get('titleweight'), size=stylesheet.get('titlesize'))
          for var in variable:
              if isinstance(var, Iterable)==True:
                  for graph in var:
                      plt.plot(graph.data[:,0], graph.data[:,1], label=graph.name)
                      plt.legend()
                      i+=1
             else:
                plt.plot(var.data[:,0], var.data[:,1], label=var.name)
                plt.legend()
i+=1I am glad you found a way to make it work, however I suggest refactoring this code a bit, something like:
def my_plot_helper(ax, graph):
    ax.plot(graph.data[:,0], graph.data[:, 1], label=graph.name)
    ax.legend()

def plotSubplots(title, row, col, fig=None, *variable, **stylesheet):
    i=1
    # if not passed a figure, make a new one!
    if fig is None:
        fig = plt.figure()
    fig.suptitle(title, weight=stylesheet.get('titleweight'), size=stylesheet.get('titlesize'))
    ax = fig.gca()  # TODO should there be subplots here?
    for var in variable:
        if not isinstance(var, Variable):
            for graph in var:
                my_plot_helper(ax, graph)
                i+=1
        else:
            my_plot_helper(ax, var)
            i+=1
This way if you decide to change your plotting code in the future you only have to change it in one place instead of two.
See https://matplotlib.org/3.1.1/tutorials/introductory/usage.html#coding-styles for more details.