Hi John,
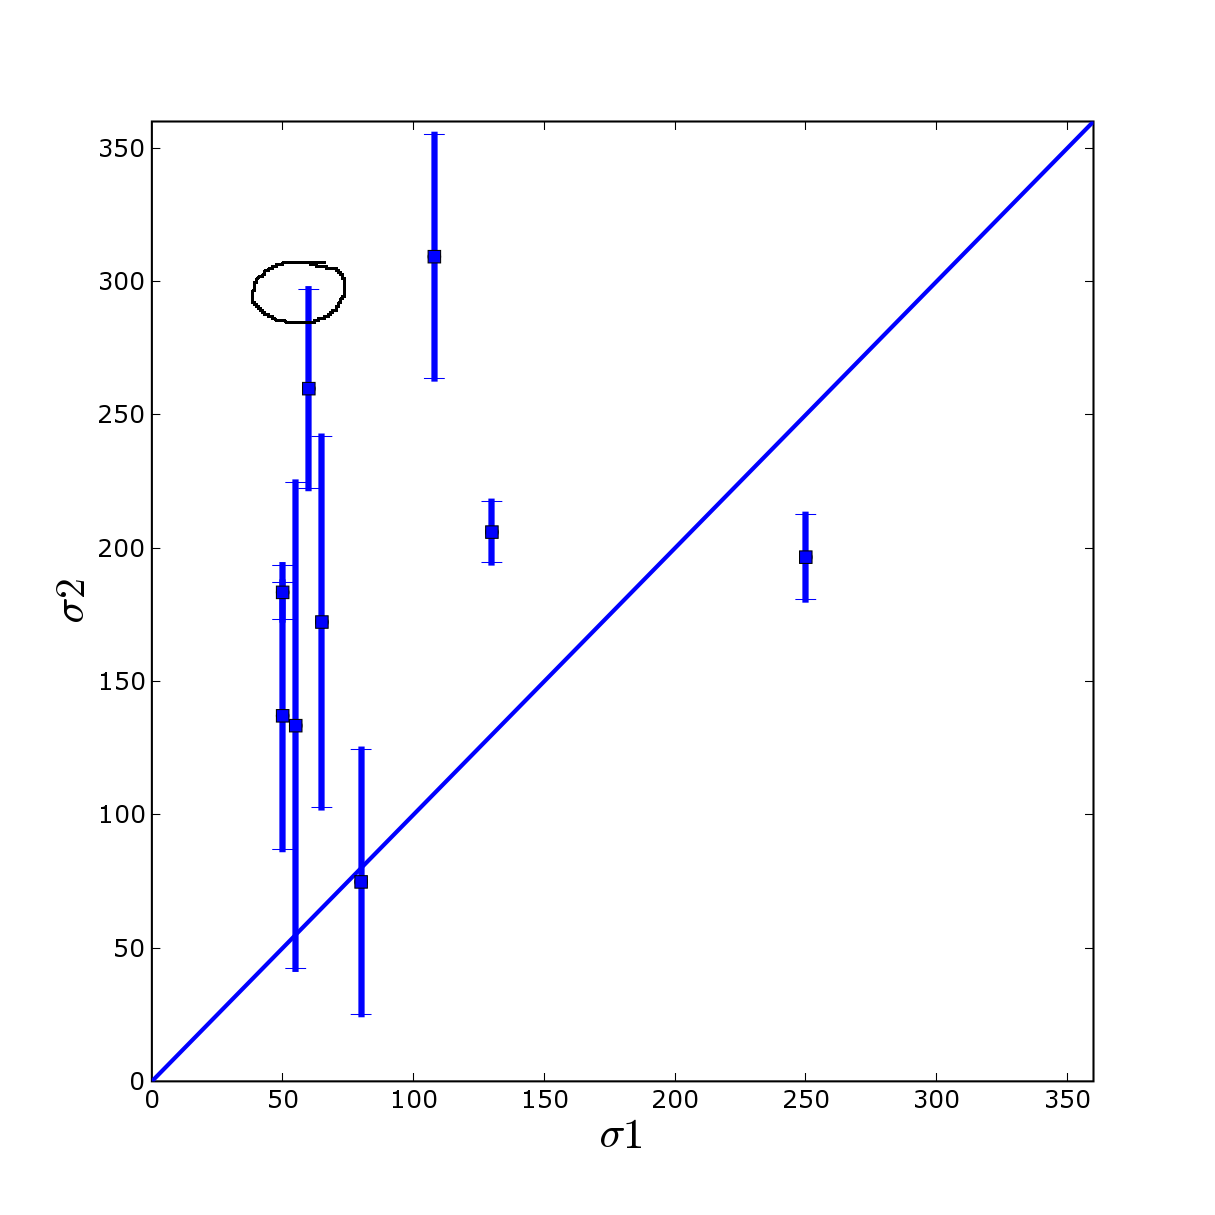
you're solution is working for the first problem but not for the second, the little tick are not changing (cf figure and script). The size of the tick lines are not change so they are not very visible if you change the size of the lines.
Nicolas
script with the problem (but all errobar script will have the same I think):
#!/usr/bin/env python
# -*- coding: utf-8 -*-
import sys
import numarray
from matplotlib.matlab import *
from math import *
sigma_final = numarray.array([74.8,172.27,206.,133.4,309.3,196.6,259.8,137.1,183.4 ])
sigma_error = numarray.array([49.6,69.54,11.4,91.2,45.7,15.9,37.3,50.,10.2])
sigma_emi = numarray.array([80.,65.,130.,55.,108.,250.,60.,50.,50.])
ligne = numarray.array([0,400])
fonts = {
'color' : 'k',
'fontname' : 'Courier',
'fontweight' : 'bold',
'fontsize' : 'xx-large'
}
figure(num = 1, figsize=(8, 8), dpi=100, facecolor='w', edgecolor='k')
xlabel('\\sigma 1',fonts)
ylabel('\\sigma 2',fonts)
errlines = errorbar(sigma_emi,sigma_final,sigma_error, fmt='o',capsize=5)
set(errlines, linewidth=3)
plot(sigma_emi,sigma_final,'s', linewidth=2)
plot(ligne,ligne, linewidth=2)
xticklabels = get(gca(), 'xticklabels')
set(xticklabels, 'fontsize', 'medium')
yticklabels = get(gca(), 'yticklabels')
set(yticklabels, 'fontsize', 'medium')
axis([0,360,0,360])
show()
John Hunter wrote:
···
"Humufr" == Humufr <humufr@...136...> writes:
> Hello, I found a problem with the
> function errorbar. I'm trying to change the width of the
> errorbar. The only way to do this seems to pass by the
> file .matplotlibrc and the default line width (it's not
> very useful I think and an option linewidth will be
> welcome in the errorbar function). The second problem is
> for the caps who are not change even with the global
> change (see figure in attachement).
You can set the linewidth of the errorbar lines and caps by using the
return value from errorbar
lines, errlines = errorbar(x,y,err)
set(errlines, linewidth=4)
Let me know if this helps. If not, please post a script that exposes
the problem.
JDH