Hi,
I need to set the frame off for my plots, so that I can have axes only on the sides I want, rather than on all four sides.
I do it this way:
from pylab import *
fig = figure(figsize=(3,2),dpi=300,facecolor=‘w’)
ax =
fig.add_subplot(111,frameon=False)
ax.add_artist(Line2D((0, 0), (0, 1),color=‘k’,linewidth=0.5))
ax.add_artist(Line2D((1, 1), (0, 1),color=‘k’,linewidth=0.5))
ax.set_yticks([0,1])
ax.set_xticks([0,1])
show()
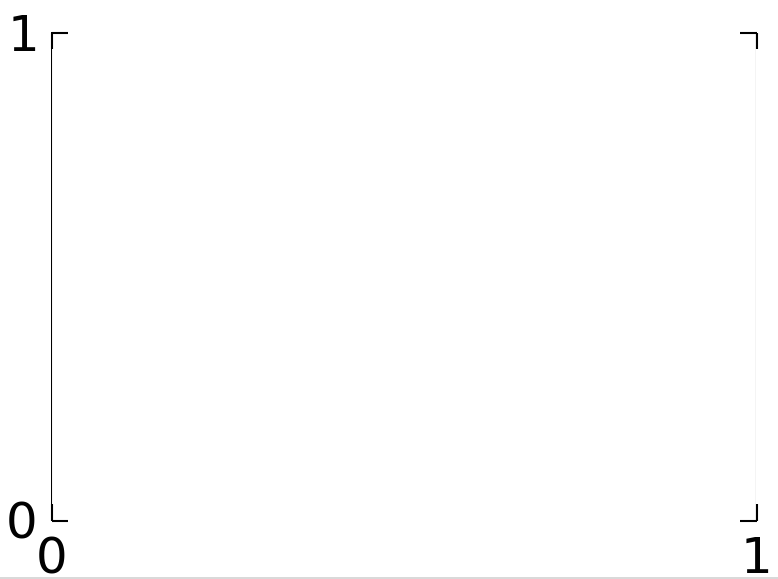
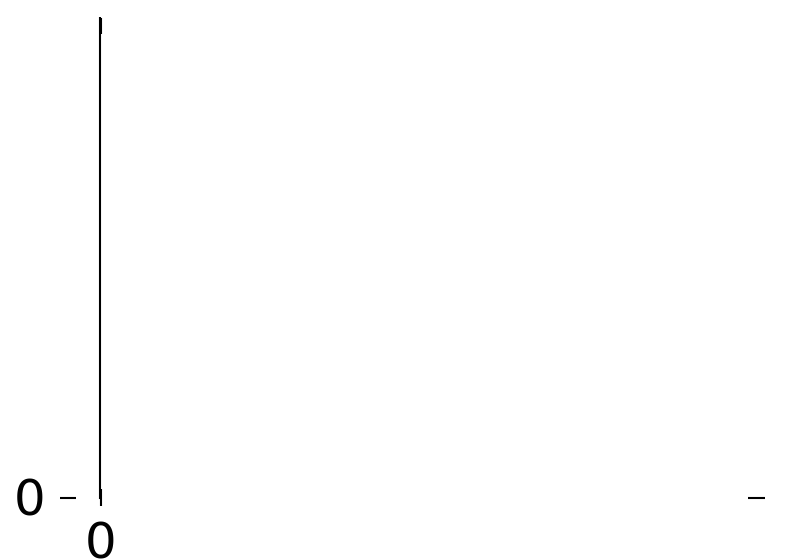
Unfortunately, now the ticks and axes-lines are misaligned, as seen in the screenshots attached. In the second screenshot, I’ve panned the plot, so the misalignment is even more visible.
matplotlib.version gives ‘1.1.1rc’
matplotlib.get_backend() gives ‘TkAgg’
···
If I use ‘WX’ backend by adding these two line before the above code (before
pylab import):
import matplotlib
matplotlib.use(‘WX’)
then the misalignment still appears to be there, but that is because the Line2Ds are clipped in their width, but the ticks are not. This is seen by panning the plot.
I can set the clipping of the Line2Ds off by doing:
l1 = ax.add_artist(Line2D((0, 0), (0, 1),color=‘k’,linewidth=0.5))
l1.set_clip_on(False)
l2 = ax.add_artist(Line2D((1, 1), (0, 1),color=‘k’,linewidth=0.5))
l2.set_clip_on(False)
So, WX backend is fine.
Backend ‘GTK’ doesn’t even have the above clipping problem.
But any workarounds for the TkAgg backend? Because my production
machine doesn’t have either wx or pygtk installed, so I can only use TkAgg.
Thanks,
Aditya.