A. Complicated to create.
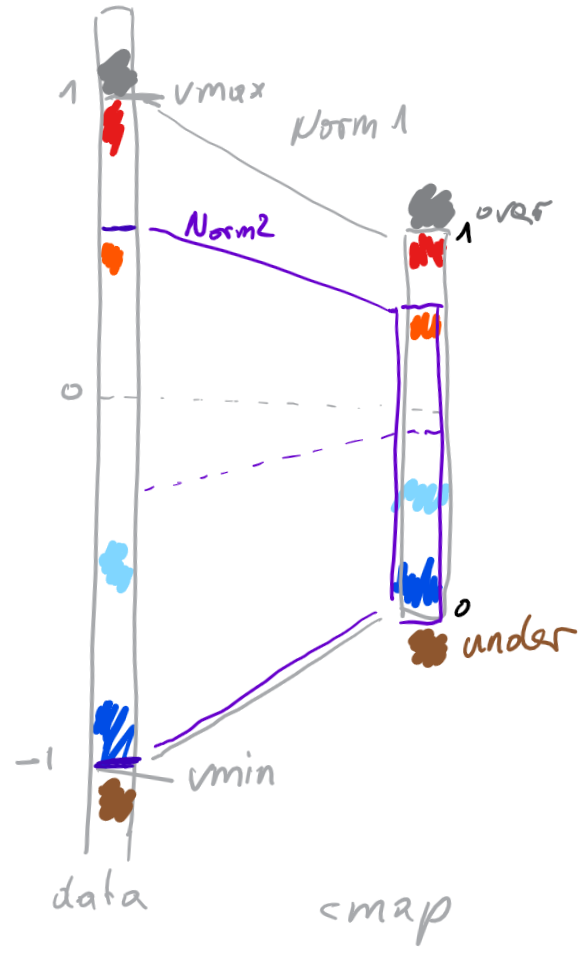
B. For diverging colormaps the color at the center of the cmap range (=0.5) is a special value. This feature gets lost in the rescaling. It replaced by a fine-tuned balance between the Norm and the Colorma (in the example norm: 0 -> 0.66, and cmap(0.66) is the sepecial value). It’s not easily possible anymore later on to exchange the colormap without regenerating the norm.
Option 1: Improved factory API
Come up with some Norm and Colormap factory API that creates these. Solves A, but not B.
Option 2: Support setting cbar limits
This gives up 3) Colorbars draw the whole colormap.
What colors should values beyond the cbar limits have?
Their cmap values? - I find this problematic because the image would contain values that are not in the colorbar, e.g. for the above example and limiting the cbar to orange, how should a user interpret red?
The over/under values? - Might be difficult to implement because the color calculation of the image is done in the cmap, but the clipping is done on the Axes. The axes would have to notify the colormap on the restriction. But what if two axes use the same colormap for two images but clip at different values?
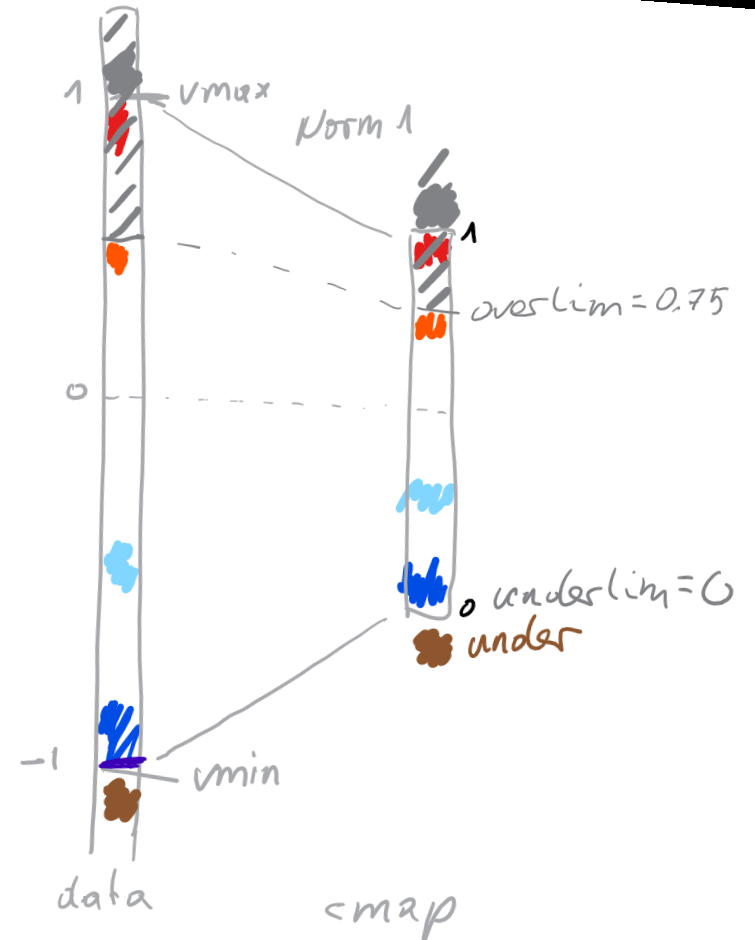
Option 3: Add over_lim and under_lim attributes to the cmap
a value of over_lim=0.75 would map values >0.75 to the over color.
I in particular also want to retain a certian mapping from data coordinates to colors, e.g. 0.5=orange.
To get that in your example I would additionally have to create a new norm. Essentially something like (untested):
def clipped_cmap(cmap_name, vmin, vmax, vmin_clip=None, vmax_clip=None):
    """
    Return a clipped but color-mapping preserving Norm and Colormap.

    The returned Norm and Colormap map data values to the same colors as
    would  `Normalize(vmin, vmax)`  with *cmap_name*, but values below
    *vmin_clip* and above *vmax_clip* are mapped to under and over values
    instead.
    """
    if vmin_clip is None:
        vmin_clip = vmin
    if vmax_clip is None:
        vmax_clip = vmax

    assert vmin <= vmin_clip < vmax_clip <= vmax
    cmin = (vmin_clip - vmin) / (vmax - vmin)
    cmax = (vmax_clip - vmin) / (vmax - vmin)

    big_cmap = cm.get_cmap(cmap_name, 512)
    new_cmap = ListedColormap(big_cmap(np.linspace(cmin, cmax, 256)))
    new_norm = Normalize(vmin_clip, vmax_clip)
    return new_norm, new_cmap
both of the above seem to be the same. Wether you return a norm from the factory and supply it to imshow, or whether you type vmin and vmax manually into imshow is the same.
Since the problem here is pretty similar to what https://github.com/matplotlib/matplotlib/pull/15333 wants to solve, I would also suggest here to solve it via a Norm alone (no new colormap needed). The difference to #15333 is that here you have no center and autoscaled limits but specify clip limits yourself. The norm could hence look like this:
import numpy as np
import matplotlib.pyplot as plt
from matplotlib.colors import Normalize
class BikeShedNorm(Normalize):
def __init__(self, vmin, vmax, clip_min, clip_max):
super().__init__(vmin=clip_min, vmax=clip_max)
self.outernorm = Normalize(vmin, vmax)
def __call__(self, value, clip=None):
result, is_scalar = self.process_value(value)
self.autoscale_None(result) # sets self.vmin, self.vmax if None
under = result < self.vmin
over = result > self.vmax
result = self.outernorm(result)
result = np.ma.masked_array(result, mask=np.ma.getmask(result))
result[under] = -1.
result[over] = 2.
if is_scalar:
result = np.atleast_1d(result)[0]
return result
np.random.seed(19680801)
data = (np.random.rand(4, 11)-0.5)*8+2
cmap=plt.get_cmap("rainbow")
cmap.set_under("white")
cmap.set_over("black")
fig, (ax1, ax2) = plt.subplots(ncols=2, figsize=(7, 2))
norm1 = Normalize(vmin=-2, vmax=6)
im = ax1.imshow(data, cmap=cmap, norm=norm1)
cbar = fig.colorbar(im, ax=ax1, orientation="horizontal", aspect=15, extend='both')
norm2 = BikeShedNorm(vmin=-2, vmax=6, clip_min=0, clip_max=3)
im = ax2.imshow(data, cmap=cmap, norm=norm2)
cbar = fig.colorbar(im, ax=ax2, orientation="horizontal", aspect=15, extend='both')
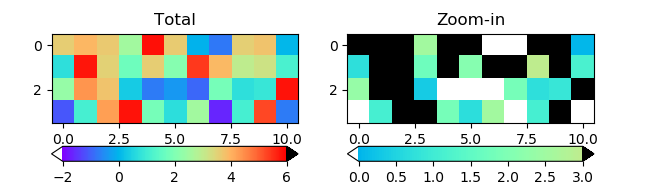
ax1.set_title("Total")
ax2.set_title("Zoom-in")
plt.show()
Agreed, you can do it either with a norm or by trimming the colormap, but I don’t think you need to do both. I am a little uncertain what happens if you change vmin or vmax after the fact if you use a norm. I guess it gets passed down to the norm?
Yes you don’t need the norm if you manipulated the colormap accordingly, because it will be set according to the input data; but that would implicitely assume that vmin/vmax are the min/max of the data. So that is to say: because, while creating the colormap, you already know the norm that gets to be chosen automatically afterwards you will not need to specifically create it.
Not sure what is meant by “change vmin or vmax after the fact”, so I cannot answer that.