Dear All,
I am using contour plot and I am drawing different contours with
different colors and linestyles and I would like to have a legend with
a caption for each contour function used.
Here you can see an example of what I would like to do
#create the 2D histogram and the x and y axis
x, y = np.random.normal(0, 0.5, 1000), np.random.normal(0, 1, 1000)
h, xe,ye = np.histogram2d(x,y, bins=25)
xe, ye = (xe[1:]+xe[:-1])/2, (ye[1:]+ye[:-1])/2lines,text = , # initialise lists
#contour plots
lines.append(plt.contour(xe,ye,h, levels=[10,9], linestyles="-", colors="k"))
text.append("level=10, 9")lines.append(plt.contour(xe,ye,h, levels=[5,4], linestyles="--", colors="r"))
text.append("level=5, 4")plt.legend(lines, text)
Everything goes well untill I plot the legend. At the end of the mail
I report the error that I get.
Anyway, if I do
plt.legend(lines)
I don't get any errors but it's quite useless, since the text of the
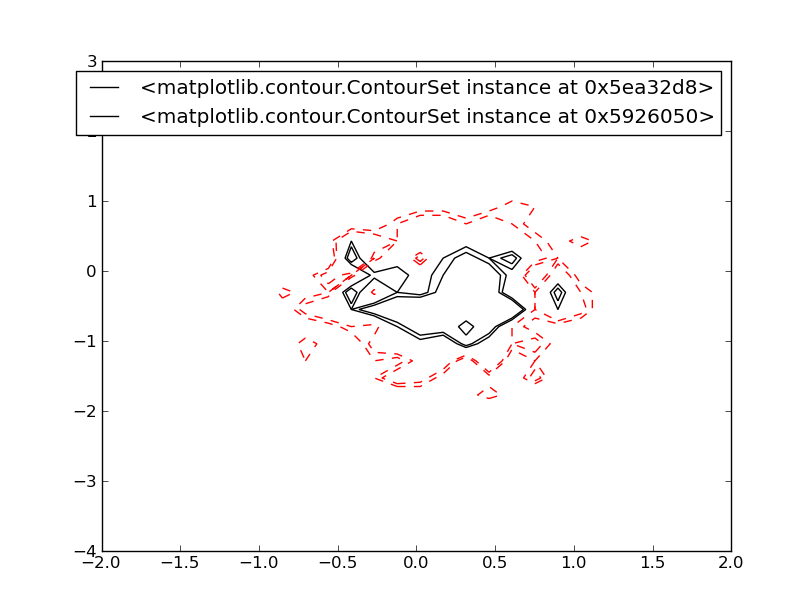
legend is just like:
<matplotlib.contour.ContourSet instance at 0x6bedc20>
as you can see from the attached figure.
I've the feeling that the problem is that "contour" gives back a
"matplotlib.contour.ContourSet instance", while the functions like
"plot" gives back a "<matplotlib.lines.Line2D object".
Does anyone knows how to do what I want?
Thanks in advance
Francesco
ps: Error message follow
···
--------------------------
/usr/lib/pymodules/python2.6/matplotlib/pyplot.pyc in legend(*args, **kwargs)
2435 # changes will be lost
2436 def legend(*args, **kwargs):
-> 2437 ret = gca().legend(*args, **kwargs)
2438 draw_if_interactive()
2439 return ret
/usr/lib/pymodules/python2.6/matplotlib/axes.pyc in legend(self,
*args, **kwargs)
4042
4043 handles = cbook.flatten(handles)
-> 4044 self.legend_ = mlegend.Legend(self, handles, labels, **kwargs)
4045 return self.legend_
4046
/usr/lib/pymodules/python2.6/matplotlib/legend.pyc in __init__(self,
parent, handles, labels, loc, numpoints, markerscale, scatterpoints,
scatteryoffsets, prop, pad, labelsep, handlelen, handletextsep,
axespad, borderpad, labelspacing, handlelength, handletextpad,
borderaxespad, columnspacing, ncol, mode, fancybox, shadow, title,
bbox_to_anchor, bbox_transform)
302
303 # init with null renderer
--> 304 self._init_legend_box(handles, labels)
305
306 self.set_title(title)
/usr/lib/pymodules/python2.6/matplotlib/legend.pyc in
_init_legend_box(self, handles, labels)
580
581 handle = handle_list[-1]
--> 582 handlebox.add_artist(handle)
583 if hasattr(handle, "_legmarker"):
584 handlebox.add_artist(handle._legmarker)
/usr/lib/pymodules/python2.6/matplotlib/offsetbox.pyc in add_artist(self, a)
473 'Add any :class:`~matplotlib.artist.Artist` to the
container box'
474 self._children.append(a)
--> 475 a.set_transform(self.get_transform())
476
477
AttributeError: 'NoneType' object has no attribute 'set_transform'