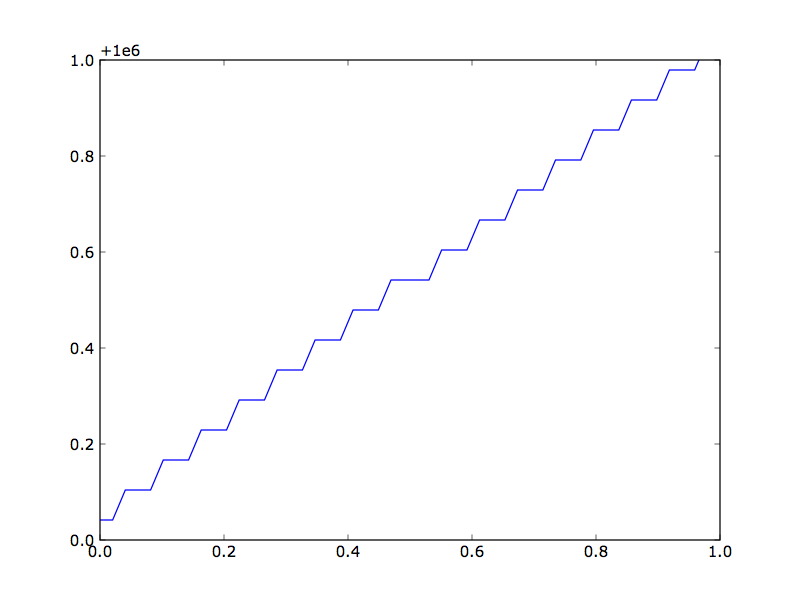
There appears to be a bug in the macosx backend. When I plot large numbers with small variations in the value, the numbers seem to be coarsely rounded off. This bug doesn't appear with other backends (I tried WxAgg and TkAgg). Below is a simple script showing the problem and the resulting plot on the macosx backend.
Thanks,
-Tony
Mac OS X 10.5.6
Matplotlib svn r6779
···
#~~~~~~~~
import numpy as np
import matplotlib.pyplot as plt
x = np.linspace(0, 1)
plt.plot(x, x + 1e6)
plt.show()
This is indeed a bug. In some places in the code, I was casting from double to float (which is used by Mac OS X quartz internally) too soon. This created a roundoff error, which shows up as the jagged plot. I am preparing a patch and will submit it as soon as possible.
Thanks for reporting this bug.
--Michiel.
···
--- On Mon, 1/12/09, Tony Yu <tsyu80@...149...> wrote:
From: Tony Yu <tsyu80@...149...>
Subject: [matplotlib-devel] Jagged plot in macosx backend
To: "matplotlib development list" <matplotlib-devel@lists.sourceforge.net>
Date: Monday, January 12, 2009, 2:59 PM
There appears to be a bug in the macosx backend. When I plot
large numbers with small variations in the value, the
numbers seem to be coarsely rounded off. This bug
doesn't appear with other backends (I tried WxAgg and
TkAgg). Below is a simple script showing the problem and the
resulting plot on the macosx backend.
Thanks,
-Tony
Mac OS X 10.5.6
Matplotlib svn r6779
#~~~~~~~~
import numpy as np
import matplotlib.pyplot as plt
x = np.linspace(0, 1)
plt.plot(x, x + 1e6)
plt.show()------------------------------------------------------------------------------
This SF.net email is sponsored by:
SourcForge Community
SourceForge wants to tell your story.
http://p.sf.net/sfu/sf-spreadtheword_______________________________________________
Matplotlib-devel mailing list
Matplotlib-devel@lists.sourceforge.net
matplotlib-devel List Signup and Options
I've written a patch that fixes this bug; see
https://sourceforge.net/tracker/?func=detail&atid=560722&aid=2508440&group_id=80706
--Michiel
···
--- On Mon, 1/12/09, Tony Yu <tsyu80@...149...> wrote:
From: Tony Yu <tsyu80@...149...>
Subject: [matplotlib-devel] Jagged plot in macosx backend
To: "matplotlib development list" <matplotlib-devel@lists.sourceforge.net>
Date: Monday, January 12, 2009, 2:59 PM
There appears to be a bug in the macosx backend. When I plot
large numbers with small variations in the value, the
numbers seem to be coarsely rounded off. This bug
doesn't appear with other backends (I tried WxAgg and
TkAgg). Below is a simple script showing the problem and the
resulting plot on the macosx backend.
Thanks,
-Tony
Mac OS X 10.5.6
Matplotlib svn r6779
#~~~~~~~~
import numpy as np
import matplotlib.pyplot as plt
x = np.linspace(0, 1)
plt.plot(x, x + 1e6)
plt.show()------------------------------------------------------------------------------
This SF.net email is sponsored by:
SourcForge Community
SourceForge wants to tell your story.
http://p.sf.net/sfu/sf-spreadtheword_______________________________________________
Matplotlib-devel mailing list
Matplotlib-devel@lists.sourceforge.net
matplotlib-devel List Signup and Options