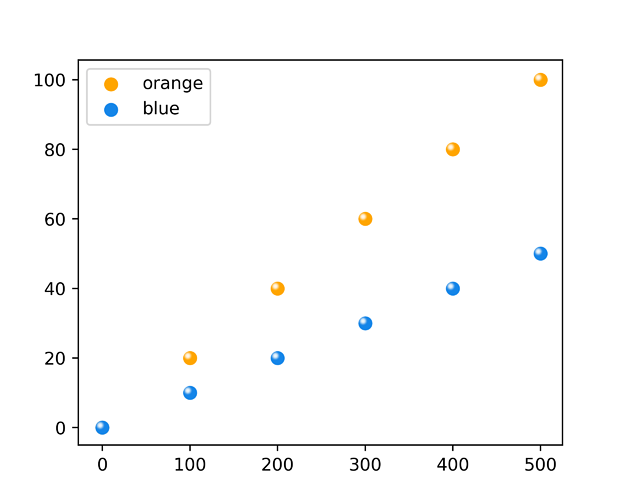
Is there a way to draw such a scatter plot?

Hi, is there a way to draw such a scatter plot?
I got this plot through these codes, but with some problems.
Firstly, the excess part needs to be erased by Photoshop.
Secondly, there is no legend.
So is there any other way to get this kind of scatter plot with sphere marker style? Create a custom maker?

import numpy as np
import math
import matplotlib.pyplot as plt
from matplotlib.offsetbox import OffsetImage, AnnotationBbox
from matplotlib.cbook import get_sample_data
def getImage(path):
    return OffsetImage(plt.imread(path), zoom=0.03)
    
fig = plt.figure(figsize=[5,4],dpi=300)
ax1 = fig.add_subplot(1,1,1)

X=[0,100,200,300,400,500]
Y1=[i*0.1 for i in X ]
Y2=[i*0.2 for i in X ]
paths1 = ['a.png']*len(X)
paths2 = ['b.png']*len(X)
for x0, y0, path in zip(X,Y1,paths1):
    ab = AnnotationBbox(getImage(path), (x0, y0), frameon=False)
    ax1.add_artist(ab)
for x0, y0, path in zip(X,Y2,paths2):
    ab = AnnotationBbox(getImage(path), (x0, y0), frameon=False)
    ax1.add_artist(ab)
plt.xlim([0,500])
plt.ylim([0,100])
plt.savefig('scatter_sphere_marker.png')


I am a new user, without permission to upload a.png and b.png. They are orange and blue shiny balls.
Hi, the marker you want can be “simulated” plotting a orange/blue circle first, then using the same data - but applying a small deviation to top and left (adjusted on trial and error basis) - overplotting a white and smaller full circle over. I think that after some trials you can reach a very close effect.

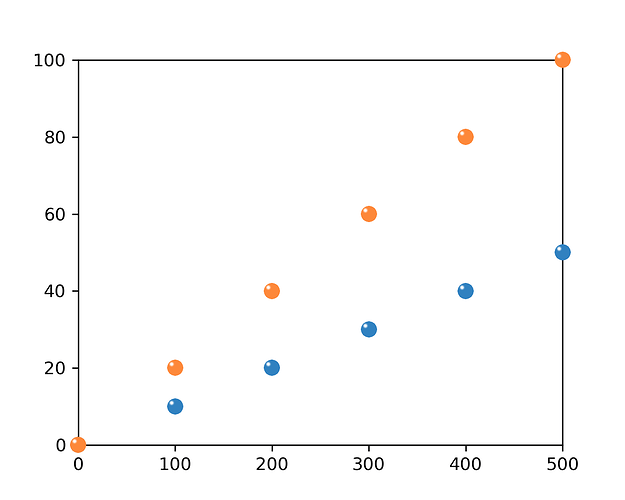
In order to clip, you need to set the clip path on the images. It is not super obvious which artist to do this on, but after some trial and error, it seems to be the underlying image:

def getImage(ax, path):
    im = OffsetImage(plt.imread(path), zoom=0.03)
    im.image.set_clip_path(ax.patch)
    return im

scatter_sphere_marker
but this is not perfect, as the annotations are drawn after the spines, and so appear slightly on top of them.

For the legend, have a look at the custom legend example and the legend guide.

However, if you can throw away the custom image and re-create it with Paths, you might have an even easier time, as you can use the usual scatter method and legend; see the marker path example.

Thanks! I just tried it and it worked great! I will upload the code later.

1 Like

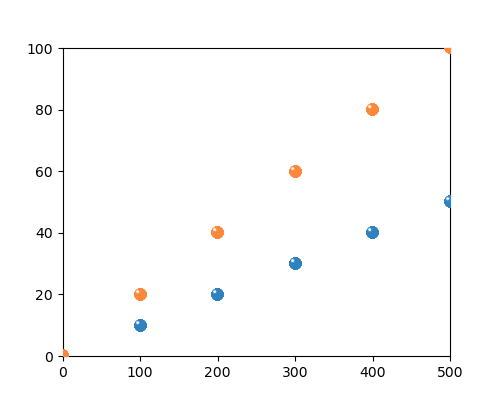
Thanks! It’s work! But I chose to use another method to draw the shiny ball, not add ball image.

According to the suggestion from @El_Uatu , I draw a colored circle first, and then a small white circle in the upper right corner. The effect is great! It is applicable to all scatter plots. BUT, the legend still be a problem.

import numpy as np
import math
import matplotlib.pyplot as plt
    
fig = plt.figure(figsize=[5,4],dpi=500)
ax = fig.add_subplot(1,1,1)
X=[0,100,200,300,400,500]
Y1=[i*0.1 for i in X ]
Y2=[i*0.2 for i in X ]
def pltspheretype(x,y,color,s,label):
    plt.scatter(x,y,color=color,s=s,label=label)
    #add shiny effect
    bbox = ax.get_window_extent().transformed(fig.dpi_scale_trans.inverted())
    width, height = bbox.width, bbox.height
    width *= fig.dpi
    height *= fig.dpi    
    xmin, xmax, ymin, ymax = plt.axis()
    xunit=(xmax-xmin)/width*(fig.dpi/72)
    yunit=(ymax-ymin)/height*(fig.dpi/72)
    x=[i-xunit*np.sqrt(s)*0.18 for i in x]
    y=[i+yunit*np.sqrt(s)*0.18 for i in y]
    n=50
    for i in np.arange(1,n):
        plt.scatter(x,y,color='white',s=(pow(n,0.5)-pow(i,0.5))/(pow(n,0.5)-pow(1,0.5))*1.8*s,
                    alpha=pow(i,5)/pow(n,5)*0.3,edgecolors='none')
pltspheretype(X,Y2,'orange',50,'orange')
pltspheretype(X,Y1,'#1485E8',50,'blue')
plt.legend()
plt.savefig('scatter_sphere_marker_overplot.png')

1 Like

Yep, but It is a very minor problem - everyone who looks at the chart can realize the meaning of the chart, despite the legend not be exactly equal to the plots.

Yes, and it can be easily solved by image processing software.

When we use logarithmic coordinates, it won’t work… :frowning:

How to solve the legend?

See Legend guide — Matplotlib 3.5.3 documentation which has an example of how to make a custom legend entry.