Is there a way to display an image using the whole canvas in jupyter notebooks?
As can be seen here, by default there is still a canvas showing, here illustrated with purple facecolor:
import matplotlib.pyplot as plt
import numpy as np
import jupyter_compare_view

fig, ax = plt.subplots(figsize=(5, 5), facecolor="purple")
array = np.fromfunction(lambda i, j: np.sin(j), (15, 15))
ax.axis("off")
ax.imshow(array, cmap="YlGnBu")

One hacky solution to hide the padding would be:
import matplotlib.pyplot as plt
import numpy as np
import jupyter_compare_view

fig, ax = plt.subplots(figsize=(5, 5), facecolor="purple")
array = np.fromfunction(lambda i, j: np.sin(j), (15, 15))
ax.axis("off")
ax.imshow(array, cmap="YlGnBu")
plt.savefig("img1.png", bbox_inches='tight',pad_inches = 0)

from IPython.display import Image
i1 = Image(filename='img1.png')
display(i1)

But it would be great if there was a better way to do this.
Maybe even a new function argument like ax.imshow(array, pad_inches = 0) ?
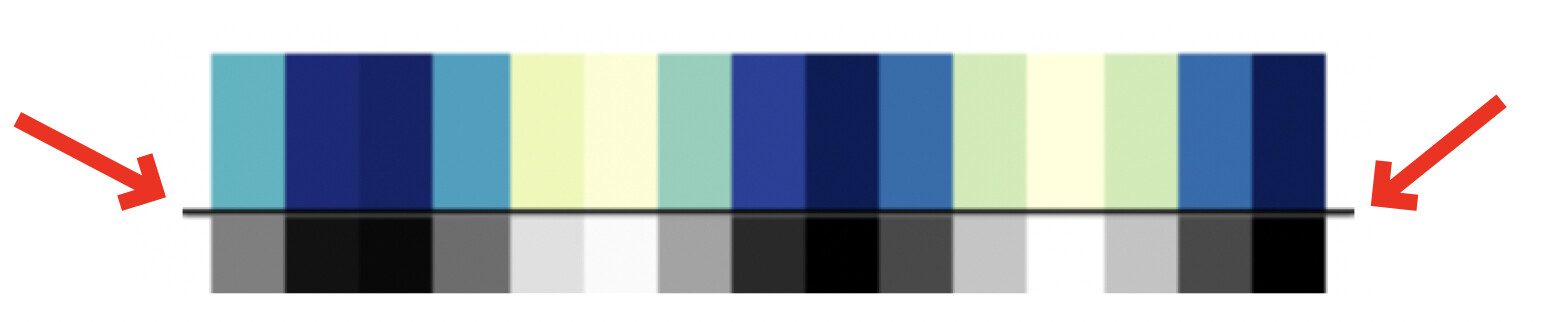
This can be very useful when comparing images with jupyter_compare_view.
Currently, the image slider is exceeding the side of the image.
It would look neat if that could be prevented;
Presumably you are working in the inline backend, in which case you can change the kwargs passed to the savefig: InlineBackend.print_figure_kwargs = {'pad_inches':0}
1 Like
Thank you so much for this line of code,
%config InlineBackend.print_figure_kwargs = {'pad_inches':0}
works like charm.
This issue is now completely solved in local Jupyter, and I’ve tried the same example in in JupyterLite.
I’ve noted that over there all plots have a huge padding around the plots, here the same example rendered in JupyterLite:
import matplotlib.pyplot as plt
import numpy as np
import jupyter_compare_view

%config InlineBackend.print_figure_kwargs = {'pad_inches':0}


fig, ax = plt.subplots(figsize=(5, 5), facecolor="purple")
array = np.fromfunction(lambda i, j: np.sin(j), (15, 15))
ax.axis("off")
ax.imshow(array, cmap="YlGnBu")
plt.show()

This applies to all matplotlib plots, not only images. Is this a known issue, or should I make a new issue at GitHub - jupyterlite/jupyterlite: Wasm powered Jupyter running in the browser 💡 ?
The in-line backend of ipython is unique in using bbox_inches=“tight”. The other backends just give you a figure that is as large as what you asked for when you created the figure.
Fwiw I think the in-line backend decision to use bbox_inches=“tight” has been a source of almost perpetual confusion. I would strongly oppose other backends adopting this behaviour even if users think they want it.
1 Like
Thanks for this clarification.
I’ve now updated the JupyterLite Demo of Jupyter_compare_view accordingly with fig1.tight_layout(), and the extra white space is gone.
It’s fantastic to see that Matplotlib can run in pyodide. From the user perspective, it would be great if the code from the local JupyterLab installation would have the same result as the same code running in JupyterLite, but I understand that different backends have different behaviour. Here is the new code for reference:
%%compare --height 400 --config '{"start_mode": "horizontal"}'
import numpy as np

array1 = np.fromfunction(lambda i, j: np.sin(j*0.1), (20, 30))
array2 = np.fromfunction(lambda i, j: np.sin(j*0.9), (20, 30))
fig1, ax1 = plt.subplots()
ax1.imshow(array1)
fig1.tight_layout()
plt.show()
fig2, ax2 = plt.subplots()
ax2.imshow(array2)
fig2.tight_layout()
plt.show()
If you want them to behave the same, I think
%config InlineBackend.print_figure_kwargs = {'bbox_inches':None}
will do the trick. I don’t think you will get ipython to change their default after so many years.
1 Like
I just tried
%config InlineBackend.print_figure_kwargs = {'bbox_inches':None}
in JupyterLite, but that does not have any effect.
Also
%config InlineBackend.print_figure_kwargs = {'bbox_inches': 'tight'}
does not remove the extra white space.
I don’t think you will get ipython to change their default after so many years.
That’s likely.
A thought that I find very pleasant: Matplotlib code in Jupyter that is consistent across the Jupyter ecosystem. So maybe {‘bbox_inches’:None} could somehow also become the default in JupyterLite?
I would be very against that.
I would be very against that.
For me, consistency within the Jupyter ecosystem would be more important than having a good bbox_inches behaviour in one backend and in one not. But I guess that’s personal taste, and I also don’t mind too much.
To return to the friendly question: Might there be any further approaches to remove the padding in JupyterLite, as %config InlineBackend.print_figure_kwargs = {'bbox_inches':None} did not have an effect?