I've just start playing with maskedarray (the new implementation) using fresh svn matplotib (0_91 maintenance).
Plotting masked array does not behave as I would have expected.
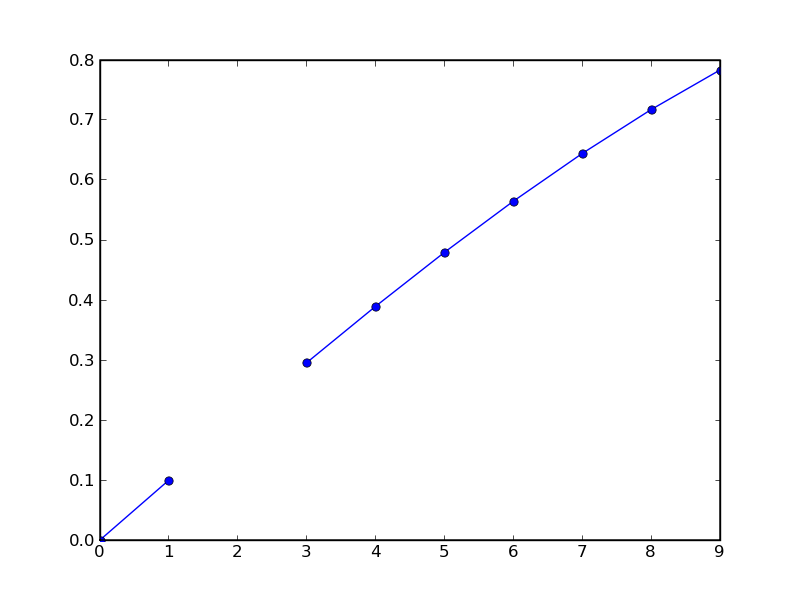
Indeed when drawing a "line graph" the masked walues interrupted the line (see attach example). I would prefer to see a continues line...
Is it the expected behavior? Is there a way to change it?
I've just start playing with maskedarray (the new implementation) using fresh svn matplotib (0_91 maintenance).
Plotting masked array does not behave as I would have expected.
Indeed when drawing a "line graph" the masked walues interrupted the line (see attach example).
David: Yes, this is the correct behavior. The masked values are treated as missing data. No attempt is made to fill, or interpolate, the missing data.
I would prefer to see a continues line...
Then you should interpolate the missing values yourself. I think it would be unwise for matplotlib to guess how you might want to do that.
-Jeff
···
Is it the expected behavior? Is there a way to change it?
Thanks in advance,
David
------------------------------------------------------------------------
-------------------------------------------------------------------------
This SF.net email is sponsored by: Microsoft
Defy all challenges. Microsoft(R) Visual Studio 2008. http://clk.atdmt.com/MRT/go/vse0120000070mrt/direct/01/
------------------------------------------------------------------------
Thanks Jeff, I think now I get the purpose of maskedearray the way it is used in matplotlib.
I have a slightly different objective: I just want to remove outliers compressed() function before 'sending' to matplotlib.
Any comments on that, any other idea?
Thanks,
David
Jeff Whitaker a �crit :
···
from my curves. I think I will still play with maskedarray and used the
David Tr�mouilles wrote:
Hi,
I've just start playing with maskedarray (the new implementation) using fresh svn matplotib (0_91 maintenance).
Plotting masked array does not behave as I would have expected.
Indeed when drawing a "line graph" the masked walues interrupted the line (see attach example).
David: Yes, this is the correct behavior. The masked values are treated as missing data. No attempt is made to fill, or interpolate, the missing data.
I would prefer to see a continues line...
Then you should interpolate the missing values yourself. I think it would be unwise for matplotlib to guess how you might want to do that.
-Jeff
Is it the expected behavior? Is there a way to change it?
Thanks in advance,
David
------------------------------------------------------------------------
-------------------------------------------------------------------------
This SF.net email is sponsored by: Microsoft
Defy all challenges. Microsoft(R) Visual Studio 2008. http://clk.atdmt.com/MRT/go/vse0120000070mrt/direct/01/
------------------------------------------------------------------------
So, you have two arrays x and y, with missing values in y that you don't want
to plot ?
Assuming that your arrays are 1D, you can try something like:
plot(x[logical_not(y.mask)], y.compressed())
in order to ensure that the x and y to be plotted have the same size.
Note that in this simple case, you don't need masked arrays, you just want to
plot point satisfying a given condition, right ?
So:
condition = (y>=min_value) & (y<= max_value)
plot(x[condition],y[condition])
will give the same results.
···
On Sunday 10 February 2008 12:40:38 David Trémouilles wrote:
I have a slightly different objective: I just want to remove outliers
from my curves. I think I will still play with maskedarray and used the
compressed() function before 'sending' to matplotlib.
Any comments on that, any other idea?
Thank you very much Pierre!
You made me discover boolean index (numpy is fantastic !)
In the mean time, I now understand the purpose of maskedarray that I totally missed at a first sight.
Thanks to all of you,
David
Pierre GM a �crit :
···
On Sunday 10 February 2008 12:40:38 David Tr�mouilles wrote:
I have a slightly different objective: I just want to remove outliers
from my curves. I think I will still play with maskedarray and used the
compressed() function before 'sending' to matplotlib.
Any comments on that, any other idea?
So, you have two arrays x and y, with missing values in y that you don't want to plot ?
Assuming that your arrays are 1D, you can try something like:
plot(x[logical_not(y.mask)], y.compressed())
in order to ensure that the x and y to be plotted have the same size.
Note that in this simple case, you don't need masked arrays, you just want to plot point satisfying a given condition, right ?
So:
condition = (y>=min_value) & (y<= max_value)
plot(x[condition],y[condition])
will give the same results.
-------------------------------------------------------------------------
This SF.net email is sponsored by: Microsoft
Defy all challenges. Microsoft(R) Visual Studio 2008. http://clk.atdmt.com/MRT/go/vse0120000070mrt/direct/01/
_______________________________________________
Matplotlib-users mailing list
Matplotlib-users@lists.sourceforge.net matplotlib-users List Signup and Options
You're quite welcome. Masked arrays are great when you need a way to flag
invalid or missing data. For simpler cases, boolean indexing can be faster
and easier to understand.
And now, for a shameless plug: if you work with series indexed with time, you
might be interested in the timeseries package (available as a scikit in http://svn.scipy.org/svn/scikits/trunk/timeseries/). The package relies on
the new numpy.ma package.
···
On Sunday 10 February 2008 13:23:13 David Trémouilles wrote:
Thank you very much Pierre!
You made me discover boolean index (numpy is fantastic !)
In the mean time, I now understand the purpose of maskedarray that I
totally missed at a first sight.