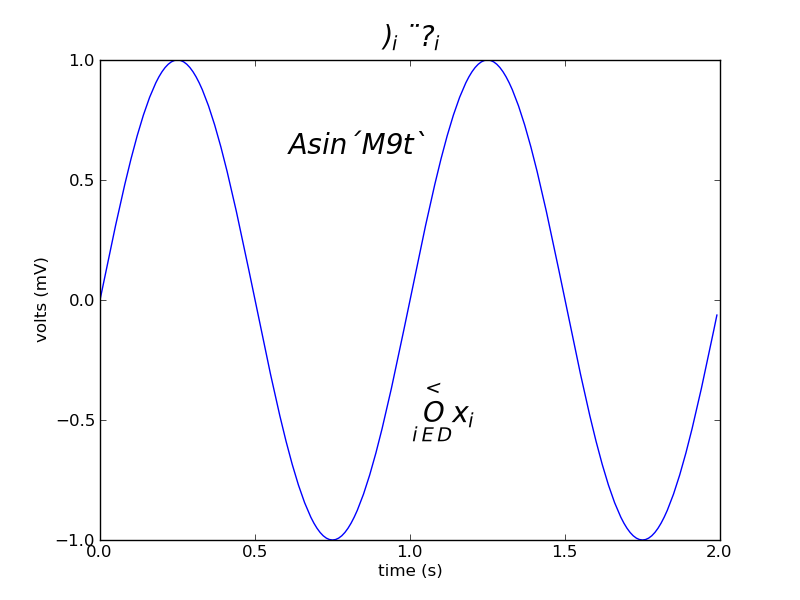
When I run the following, I get gibberish for the math symbols: ),?,"
instead of alph's, beta's, ..., etc.
I believe I have all the correct fonts installed: stix, computer
modern. I have tex and latex installed.
Any suggestions? I am running FC12.
Thanks,
Jeff
1 import numpy as np
2 import matplotlib.pyplot as plt
3 t = np.arange(0.0, 2.0, 0.01)
4 s = np.sin(2*np.pi*t)
5
6 plt.plot(t,s)
7 plt.title(r'$\alpha_i > \beta_i$', fontsize=20)
8 plt.text(1, -0.6, r'$\sum_{i=0}^\infty x_i$', fontsize=20)
9 plt.text(0.6, 0.6, r'$\mathcal{A}\mathrm{sin}(2 \omega t)$',
10 fontsize=20)
11 plt.xlabel('time (s)')
12 plt.ylabel('volts (mV)')
13 plt.show()
Can you set the rcParam ‘verbose.level’ to ‘debug-annoying’ and send us
the output?
What version of matplotlib? Which backend?
Mike
···
http://p.sf.net/sfu/thinkgeek-promo
Matplotlib-users@lists.sourceforge.nethttps://lists.sourceforge.net/lists/listinfo/matplotlib-users
-- Michael Droettboom
Science Software Branch
Space Telescope Science Institute
Baltimore, Maryland, USA
You may also want to clear your fonts and tex cache
rm -rf ~/.matplotlib/font*.cache
rm -rf ~/.matplotlib/tex.cache
though this is probably not the source of your problems....
JDH
···
On Fri, Jun 11, 2010 at 7:50 AM, Michael Droettboom <mdroe@...86...> wrote:
Can you set the rcParam 'verbose.level' to 'debug-annoying' and send us the
output?
What version of matplotlib? Which backend?