I'm using Matplotlib 1.2.0 (provided as a package by an external
supplier) on an OpenSuSE 12.2 system using Python 2.7 and (I think)
the GtkAgg backend. I wrote a simple application that reads a CSV
file and displays one or more pairs of columns. I use it pretty much
constantly.
Yesterday I discovered pylab.Figure.tight_layout, and love it because
I get a significant chunk of my screen back. Alas, interactive
display of x,y coordinates seems to have gotten rather spotty.
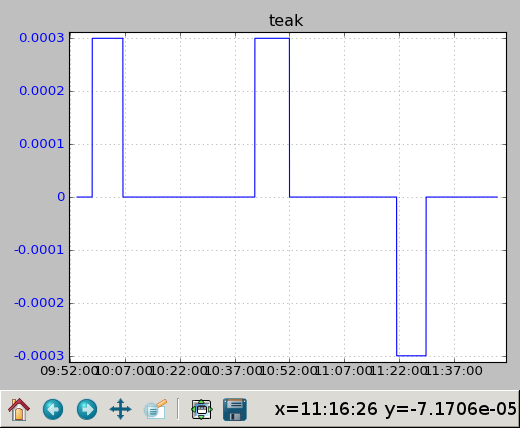
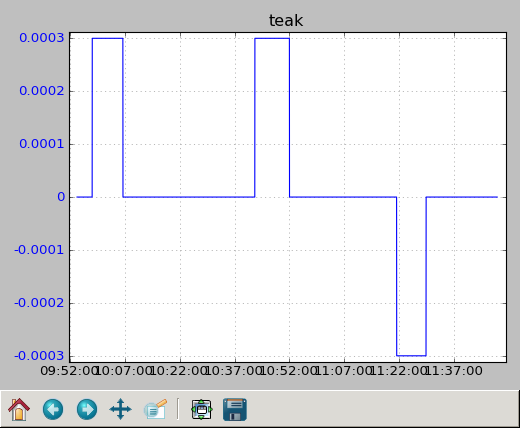
Consider the two attached PNG files. Same plot. One shows the x,y
coordinates in the lower right-hand corner, the other doesn't. The
only thing different is the motion/position of the mouse.
Any thoughts about this? Is it a known problem (that is hopefully
fixed in 1.3)?
Thanks,
Skip Montanaro